Outside of specialized applications, most programmers have traditionally kept their focus on CPUs. Until recently, CPUs were the only substantial processing power in most machines. However, since powerful GPUs are a standard component in a wide variety of devices, the CPU is now accompanied by other computing options.
Developers can leverage the additional processing power of GPUs and other processors in conjunction with traditional CPUs. To do so, you need to adopt parallel programming techniques to create applications with cross-architecture capabilities.
Intel’s oneAPI provides a powerful suite of tools for developers to ensure their software takes full advantage of cross-architecture resources, making the most of hardware features in a diverse platform environment. oneAPI enables you to think about the possibilities of enhancing your applications with some extra GPU processing power.
Moving to Cross-Architecture
One of oneAPI’s critical features is code reusability. Using the Khronos SYCL standards for data parallelism, C++ developers can leverage existing code or write code that works with CPUs, GPUs, and FPGAs. With this approach, you can optimize fine-tuning for specific platforms. This reusability allows you to seamlessly offload code on different processing platforms, providing an impressive degree of flexibility in designing and optimizing cross-architecture applications.
Making good use of these extra computing resources requires more than just changing the code itself. It also requires developers to re-think their strategies for designing software. The heterogeneous parallel programming approach introduces new challenges, and questions quickly arise about which platforms should execute which pieces of code.
To help developers answer these questions, Intel has added oneAPI’s cross-architecture capabilities to Intel® Advisor and Intel® VTune™ Profiler. Both are also available for standalone download.
The Intel Advisor analysis tool identifies opportunities for profitable GPU offloading. It also offers insights into improving vector parallelism efficiency, monitors performance against hardware limitations, and helps design, visualize, and analyze flow graphs, among other functions.
Using Intel Advisor, you can quickly understand what loops within your code are good candidates to offload to the GPU. The Intel Advisor estimates data-transfer costs between host and target devices and provides recommendations for optimizing data transfer. It also identifies loops that can benefit from improved vectorization, providing actionable guidance for enhancing vectorization efficiency.
With the help of Intel Advisor, you can test and analyze your applications to incorporate GPU processing power. It also helps you to identify potential performance gains before making code changes, even without accessing the physical hardware. The Intel Advisor performs advanced offload modeling, enabling it to test code on platforms modeled in the software. This capability makes it a powerful tool for designing applications tuned with the GPU in mind.
The Intel VTune Profiler helps identify the most time-consuming GPU kernels for further optimization. It helps determine if the application is GPU- or CPU- bound. It helps analyze GPU-bound code for performance bottlenecks caused by microarchitectural constraints or inefficient kernel algorithms.
Intel VTune Profiler provides a broad set of profiling capabilities to find and fix bottlenecks quickly for improving the performance of cross-architecture applications. When synergized with Intel Advisor, these two tools provide developers with the insights necessary to demystify their cross-architecture implementations.
Optimizing with Intel Advisor and Intel VTune Profiler
In the Design and Tune Your Applications for GPUs webinar, consulting engineer Jennifer DiMatteo demonstrates the capabilities of the Intel Advisor using a slightly modified Mandelbrot OpenMP sample. OpenMP provides its own set of capabilities for multi-platform programming and synergizes well with oneAPI.
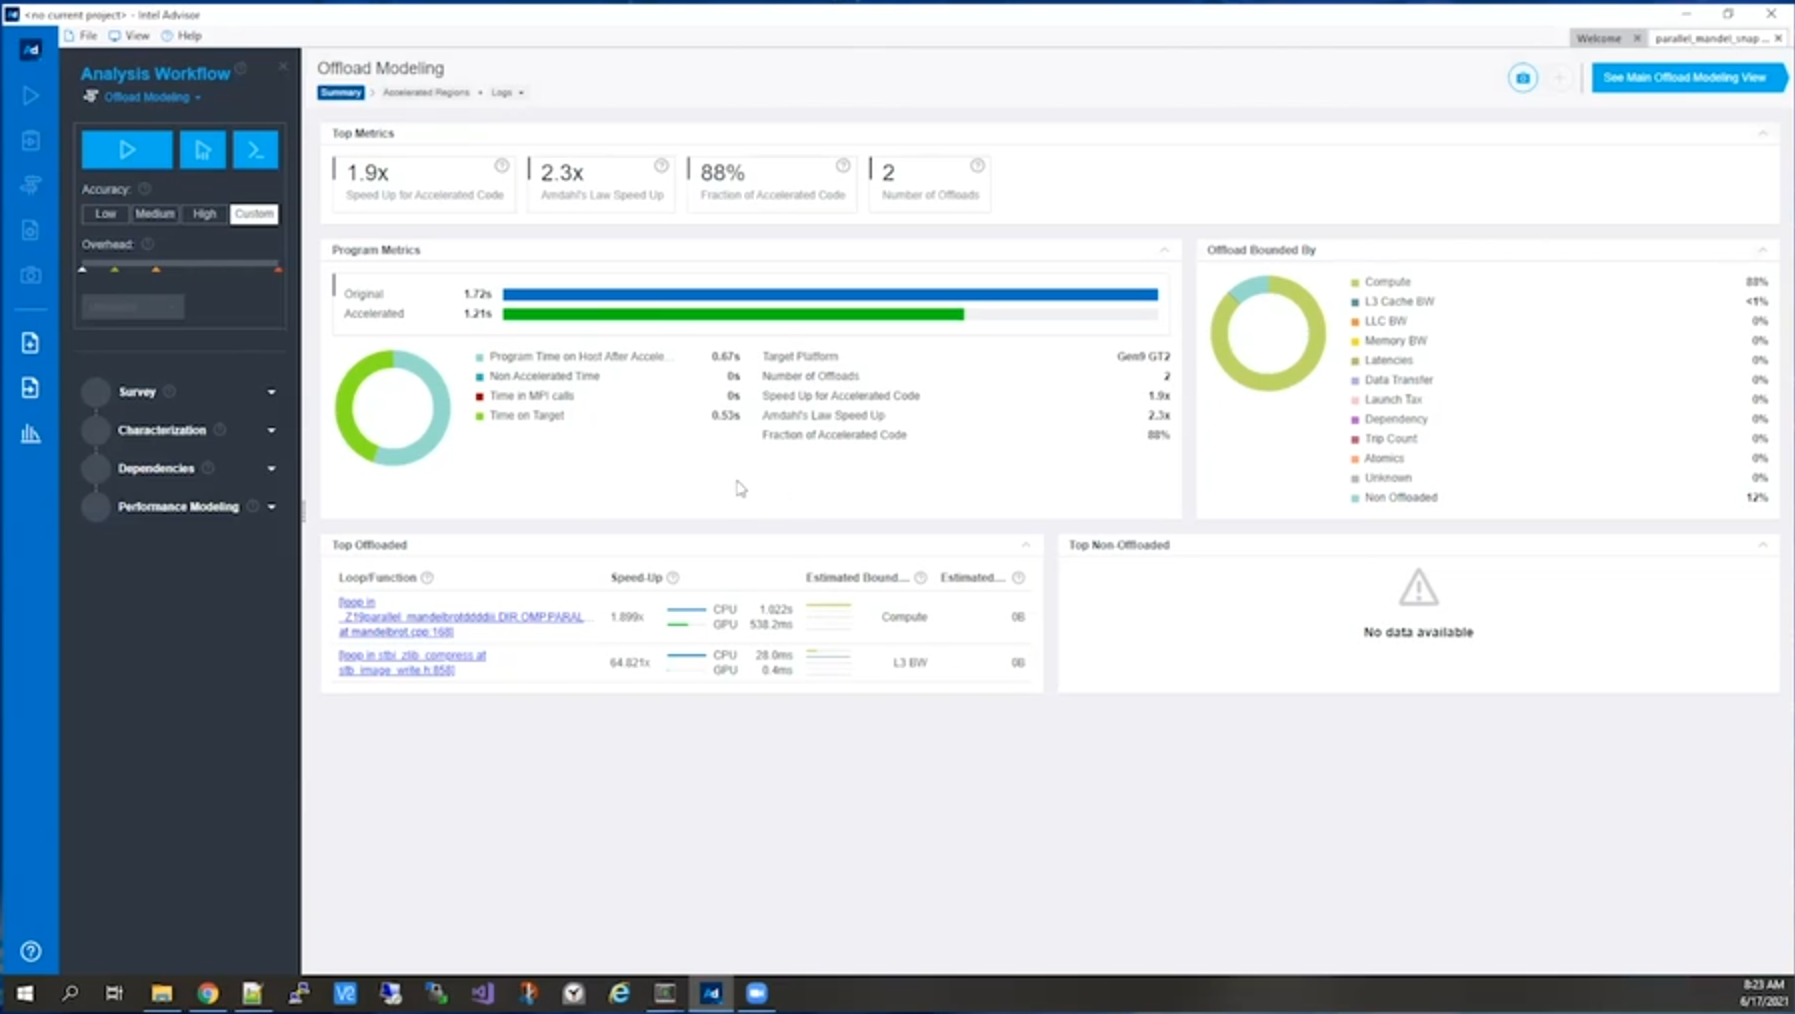
In this demonstration, Jennifer runs the Mandelbrot sample through the Intel Advisor’s Offload Modeling. Jennifer quickly identifies which parts of the code are suitable for offloading to the GPU and estimates how much the improvements can accelerate the application using the Intel Advisor’s GUI view for better visualization, as the screen capture below shows.

During the demonstration, Jennifer zeroes in on a particular loop from within the Mandelbrot set. The Offload Modeling identifies an opportunity to increase a specific loop’s speed by nearly 1.9 times simply by offloading to the GPU.
Jennifer then goes to a level deeper to investigate metrics that Intel Advisor returns regarding the loop. She quickly views stats about throughput, data transfers, cache use, latencies, and other factors affecting the loop’s performance. The Intel Advisor highlights specific sections of the code identified for offloading and provides actionable recommendations for the best way to implement the offloading suggestions the modeling offers.
In Jennifer’s example, the Advisor offers suggestions for her to use unified shared memory (USM) to optimize data transfer. It also finds suggestions for improving an OpenMP map clause and offers some example Pragma code to suggest how she might improve the implementation.
After implementing changes based on Intel Advisor’s recommendations, Jennifer tests the code using the suggested offloading. In this instance, the specific loop that she offloaded to the GPU increased its performance and reduced execution time.
However, the change introduced some overhead, increasing the program’s overall execution time on the CPU. Armed with this information, Jennifer can continue to delve into what added the overhead or determine that this loop isn’t a good candidate for offloading and return to the original configuration.
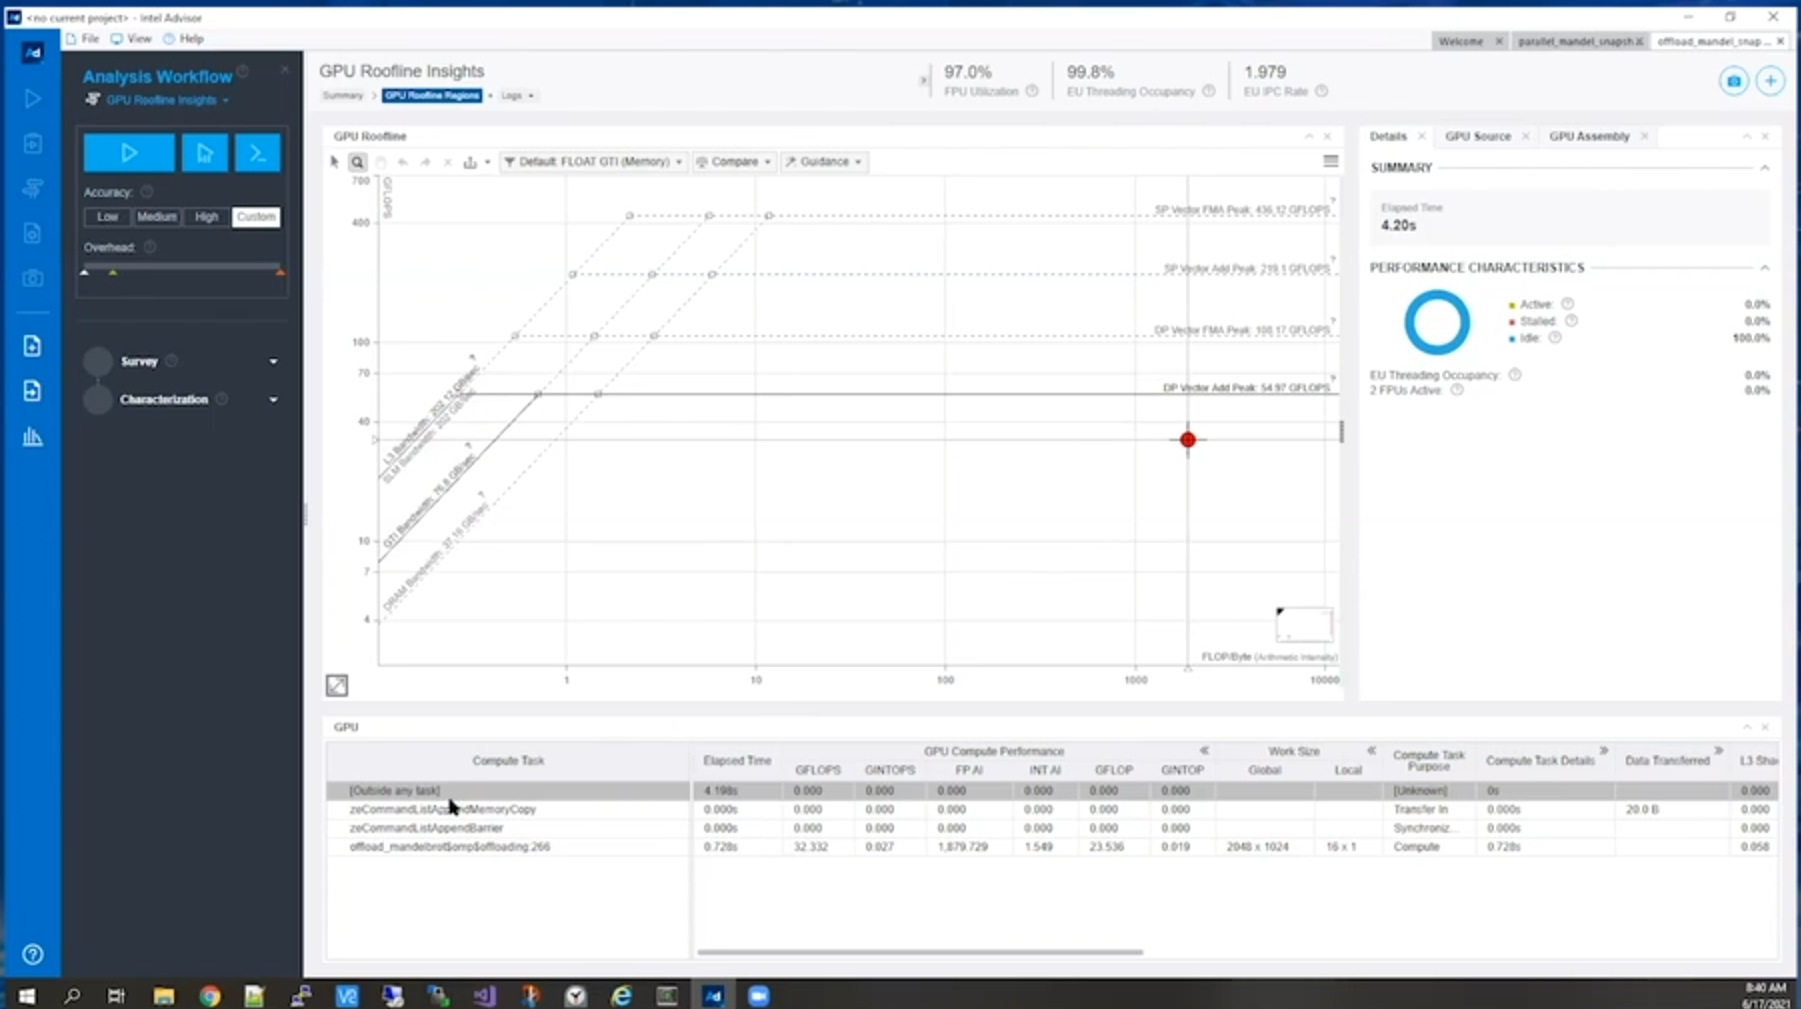
To determine the source of the extra overhead, Jennifer dives into the Intel Advisor’s GPU Roofline Insights to identify what is slowing the code. Using the Intel Advisor GUI’s rich visualization, as the following screen capture shows, Jennifer quickly identifies areas where she can make changes to improve performance and eliminate the overhead the original modifications introduced.

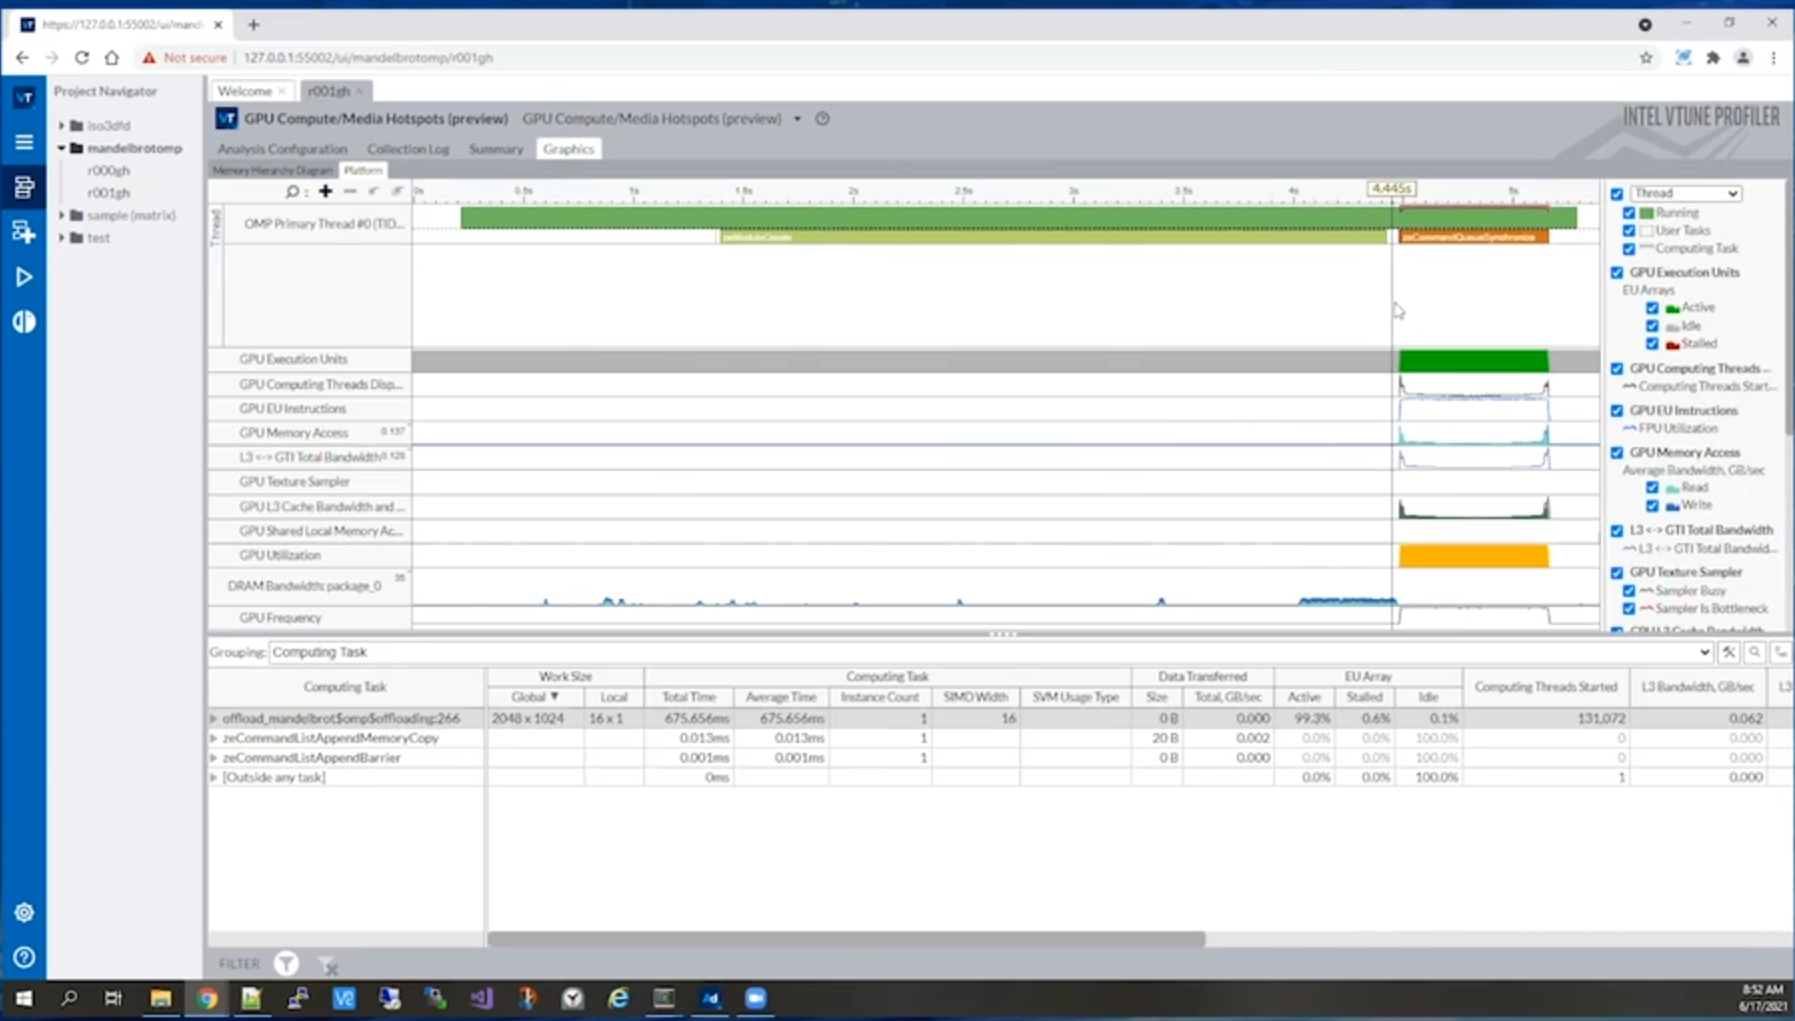
To find the overhead issue’s underlying cause, Jennifer turns to the Intel VTune Profiler. Opening the Intel VTune Profiler GUI in her browser, Jennifer runs her modified Mandelbrot example through the profile, performing a “GPU Compute Media Hotspot” analysis. From this analysis, Jennifer views a graphical timeline of how her program ran across the different platforms, as the screen capture below shows, enabling her to visualize the cross-architecture performance quickly.

This timeline shows Jennifer that a specific task, zeModuleCreate, is introducing the new overhead. With information about the specific task causing the issue, Jennifer can quickly determine a solution. In this case, the task is offloading to a GPU without any details on the GPU, which must be determined at runtime. Specifying which GPU and architecture to use at compile time or ahead-of-time (AOT) minimizes the task’s execution time.
The combined capabilities of Intel Advisor and Intel VTune Profiler enable Jennifer to gain deep insights into complex cross-architecture performance issues. She quickly identifies optimizations, implements them, and identifies opportunities for further improvement by analyzing the Intel VTune Profiler’s detailed metrics on performance and bottlenecks.
Try It!
Want to see what you can do with cross-architecture capabilities? Bringing the GPU into play, lets you create high-powered applications that squeeze every drop of computing power from a machine. Or, you can make more lightweight applications that selectively use cross-architecture capabilities to remain fast and lean.
Here are some resources to get started with oneAPI and test your code’s performance. You may discover a whole new world of cross-architecture possibilities:
