This is Part 3 of a 3-part series that explores how to create an end-to-end streaming solution starting by streaming data into Azure Event Hubs, processing it with Azure Functions in Java, and piping the results into a Cosmos DB database. This article shows how to use Power BI for ad-hoc analysis and create powerful dashboards.
So far in this series, we’ve explored how to stream data to an Event Hub and consumed, processed, and stored the data in Cosmos DB. In this final article of the series, we'll analyze and visualize this data in Cosmos DB using Power BI.
Power BI is Azure’s data analysis tool, enabling company-wide, self-serve analytics at scale. We can find meaningful insight by visualizing data and using inbuilt AI capabilities. We can also export and share these insights to Excel or other data tools.
We'll use Power BI to analyze our Cosmos DB data and view Bitcoin values versus US dollars. Go to GitHub to find the full code required to stream data to an EventHub and process and store it in Cosmos DB.
Before we dive into Power BI, let’s test streaming our Event Hub data into Cosmos DB so we can ensure our functions work as intended and generate sample data to analyze.
Streaming Event Hub Data into Cosmos DB via an Azure Function
In the first article, we built a Java application to consume a real-time blockchain exchange feed and sent the messages in batch to an Event Hub. By streaming to Event Hub, we can effortlessly scale to meet the demand if our message throughput increases. We can also attach multiple downstream consumers to process the messages.

We’ll run this application to start data flowing into our Event Hub. Follow the steps in the first article to get your Java application up and running. Your application should output the messages to the screen like the screenshot above. The monitoring metrics within the Azure Event Hub portal should reveal that the Event Hub is receiving messages like in the screenshot below.
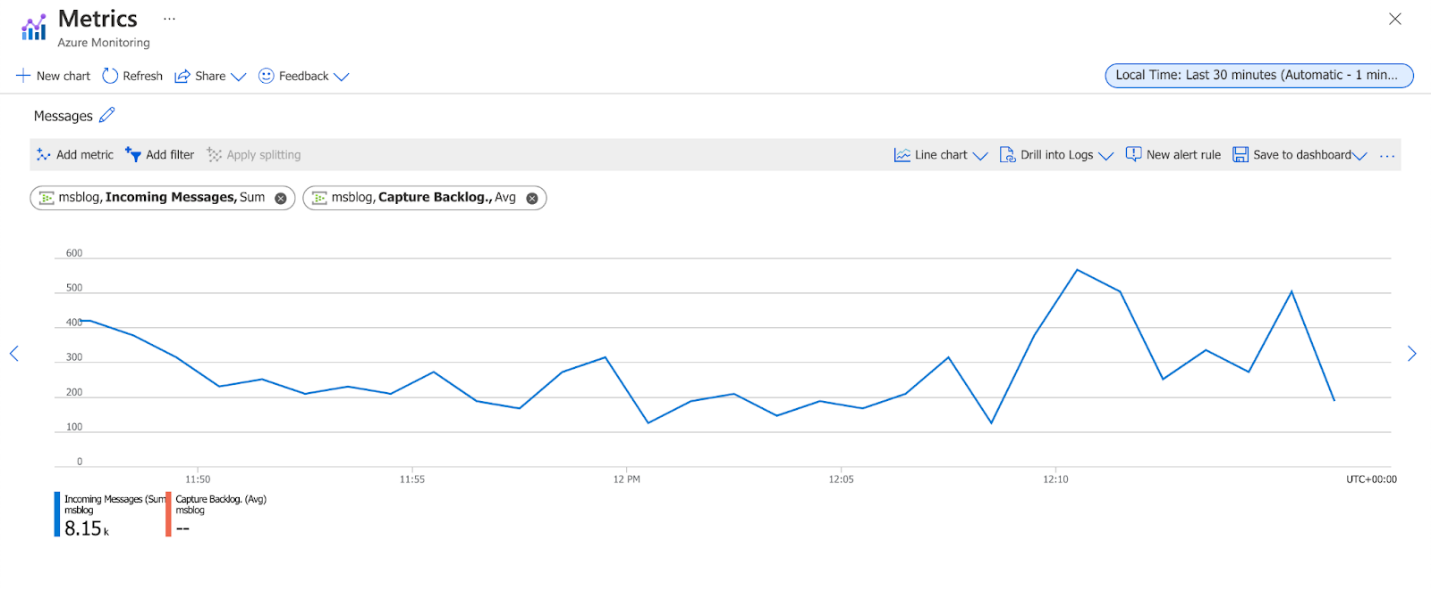
Now our EventHub is receiving messages. We can move on to the Azure function we created in the second article. Again, by using Azure Functions to process the messages from the Event Hub, we enable Azure to handle the infrastructure for our application logic. We can also set the function to automatically scale to meet spikes in message throughput, which is especially helpful to meet message-processing service-level agreements (SLAs) for near real-time systems.
You can run the Azure Function locally using VS Code by following the steps in the second article, or you can deploy it to Azure. To deploy from VS Code, open the Command Palette and select Azure Functions: Deploy to Function App like the screenshot below:

The application parses our JSON-formatted Blockchain Exchange messages to prepare for storage. The message contains a property holding an array of values.
We parse the array and break the values into individual properties to store and independently query them within Cosmos DB. This format enables us to analyze the data
When you run the application locally, you should see the triggered Function, which sends the data to Cosmos DB. You can also use the monitoring graph in the Event Hub portal to check how many outgoing messages there are, like in the screenshot below. Event Hub tracks incoming and outgoing messages, which can help you understand how far behind your consumer is. If the number of outgoing messages is higher than incoming, your consumer is probably catching up.

In the screenshot above, the incoming and outgoing message rate is the same, so our consumer is scaled appropriately to meet the demand of messages coming in.
We can now check that data is making its way into Cosmos DB by running a SQL query from the Data Explorer in the portal. After initially running the applications, your count should show the first couple hundred messages that have arrived, like in the screenshot below.
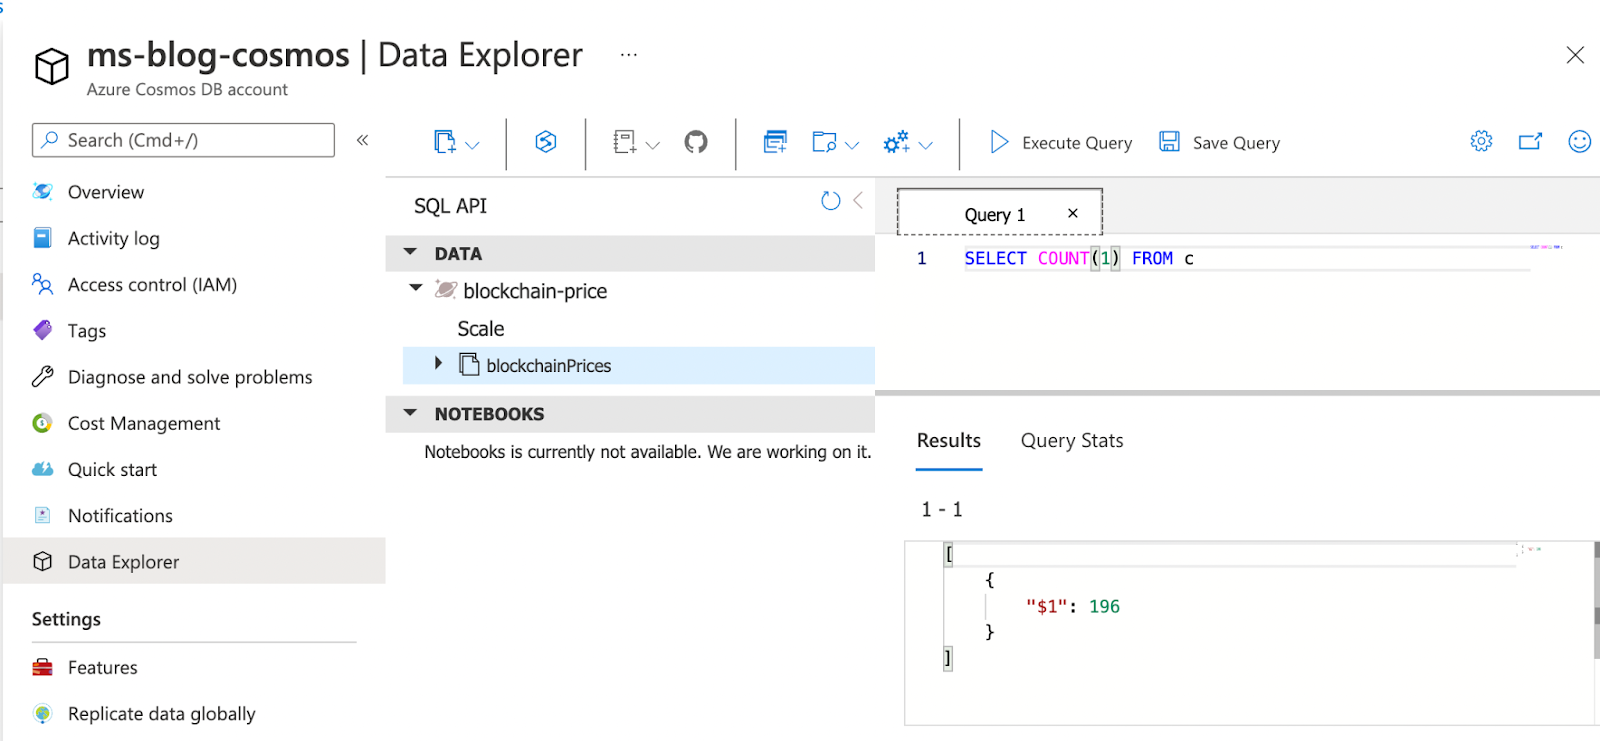
If you rerun the count after leaving the applications running for a while, you should see the number of records increasing, like in the screenshot below.
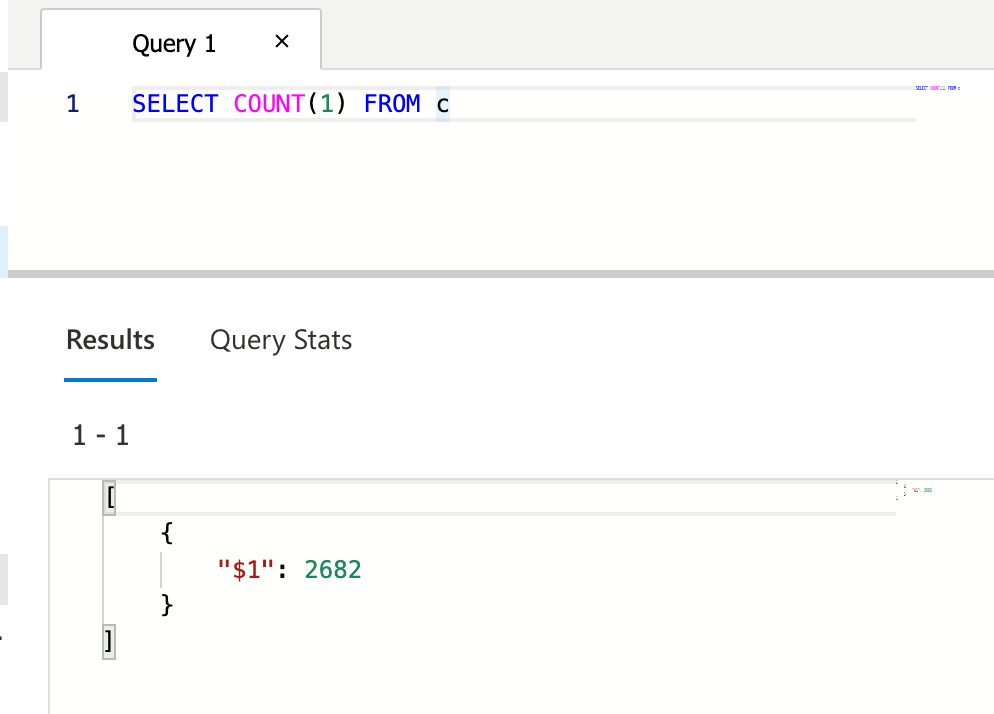
Leave the applications running for a while. We’ll create a report in Power BI in the next step, so we want to make sure we have a large enough data set to analyze.
Analyzing Data in Cosmos DB Using Power BI
First, download and install the Power BI desktop application to use a Cosmos DB data source within Power BI. Then, create a new report in Power BI. At the top, select Get Data, and click More. This action opens a window like in the screenshot below. It shows all the possible data connectors within Power BI.

We use Azure Cosmos DB as this is where our data is. Click Connect. Power BI will prompt you to enter some connection details. You can find these details within the Keys section of Cosmos DB in the Azure portal. Read-write and read-only keys are available, and we can use the read-only keys as Power BI won't be modifying any data. You'll need the URI and primary key. Enter the database and collection name, too.
This action opens the data source query window. It shows only a single column representing the whole document by default. We'll split the document into its separate properties to use them within our report.
Click the expand button like in the screenshot below. Select all the columns, then click OK.
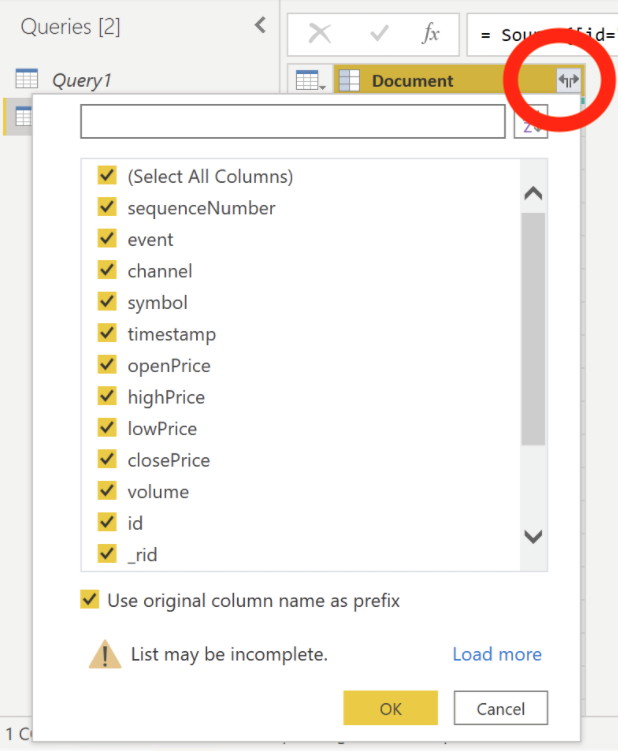
The view should refresh, and we should now see our properties within their columns. Next, click the arrow icon to the left of the column name to set the data types for the price columns as $ Fixed decimal number. We do this so that Power BI treats them as numbers and knows what computations are available.
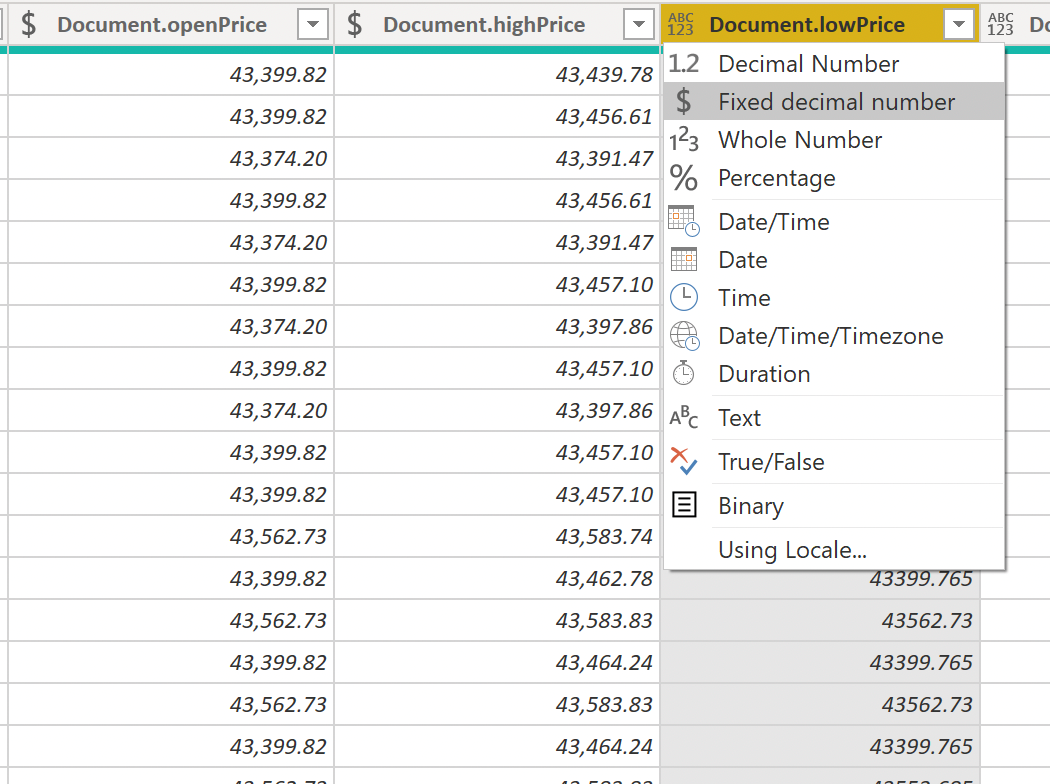
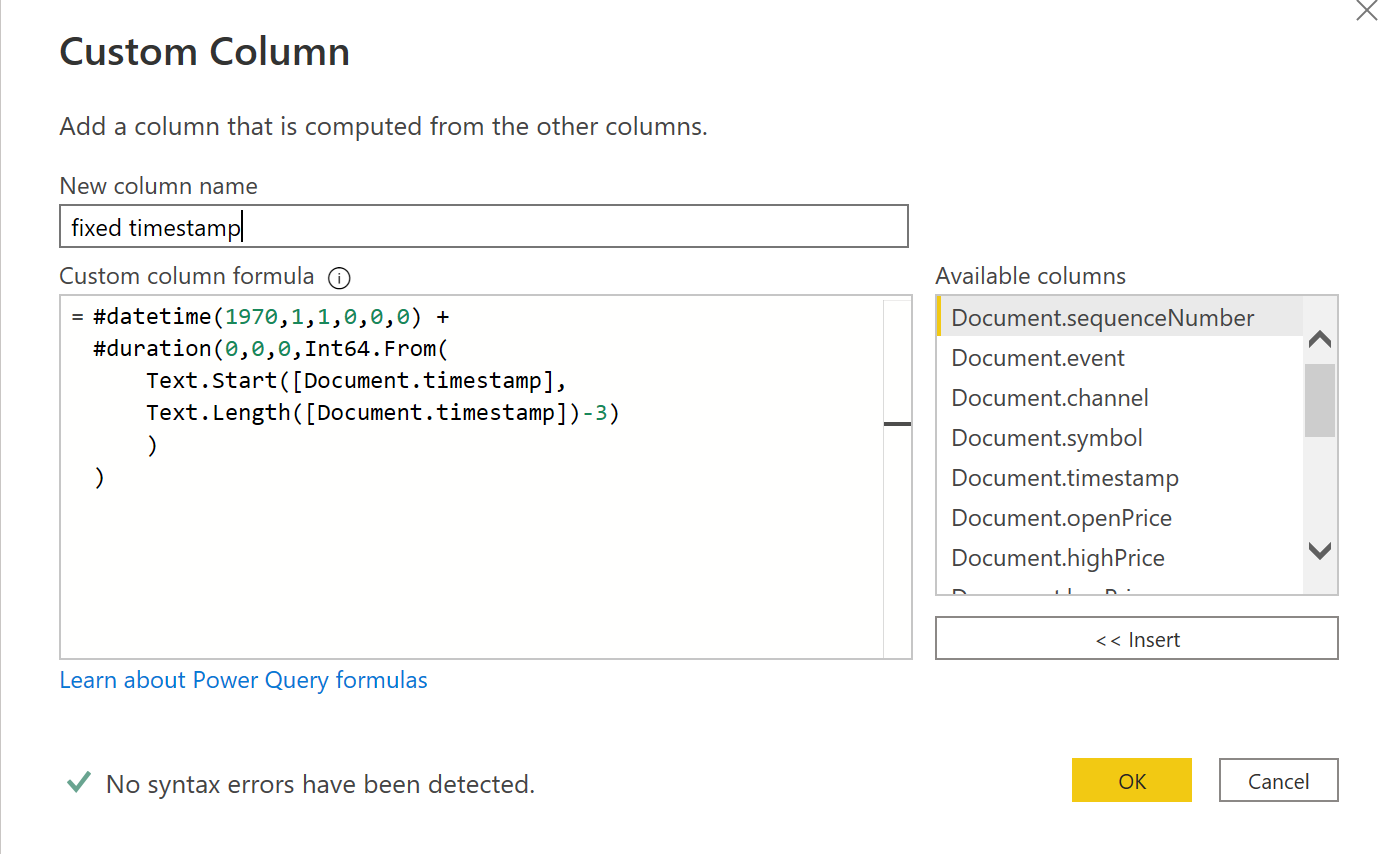
Also, convert the timestamp column to a typical date format. Currently, it’s a Unix timestamp. Click Custom Column to create a custom column to adjust the date, like the screenshot below. This new column enables us to write a formula to transform the Unix timestamp into a date.

Here’s the formula to convert the Unix timestamp:
= #datetime(1970,1,1,0,0,0) + #duration(0,0,0,Int64.From(Text.Start([Document.timestamp],Text.Length([Document.timestamp])-3)))
The formula starts with January 1, 1970 (the Unix timestamp epoch). It removes the last three precision characters from the Unix timestamp because they aren’t required. Then, it casts the Unix timestamp to an integer. Finally, it adds this integer version of the timestamp onto the epoch date as a duration in seconds.
When the column is ready, we need to tell Power BI that this new column is a date using the same method as prices. This helps Power BI understand which operations are possible, like using the field as a time series in reports.
Click Close and Apply to return to the report builder window.
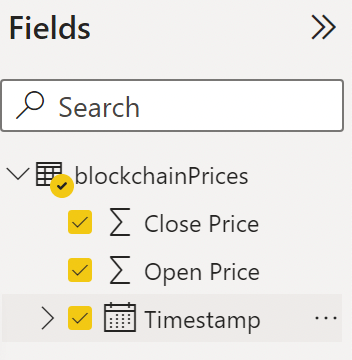
On the right side, you should now see a list of fields. The screenshot below shows a condensed version of the fields we used in our report. We’ve also renamed them by right-clicking then typing a new name.
Simply tick the fields you want to include, and a table will appear on the left side.

By default, Power BI makes some assumptions about displaying the data. It usually shows dates split into the year, month, and day and sums any numeric fields.
We don't want to do this for our report. To modify it, go to the Values section like in the screenshot above. Select the arrow next to the Timestamp column and change it from Date Hierarchy to Timestamp. Power BI will still aggregate but only down to the minute level, which is fine.
Because it’s still aggregating, we don't want to sum our close and open price fields. We want to see their highest value for that specific minute in time. To do this, select the arrow next to the fields in the Values section, then change the value from Sum to Max.
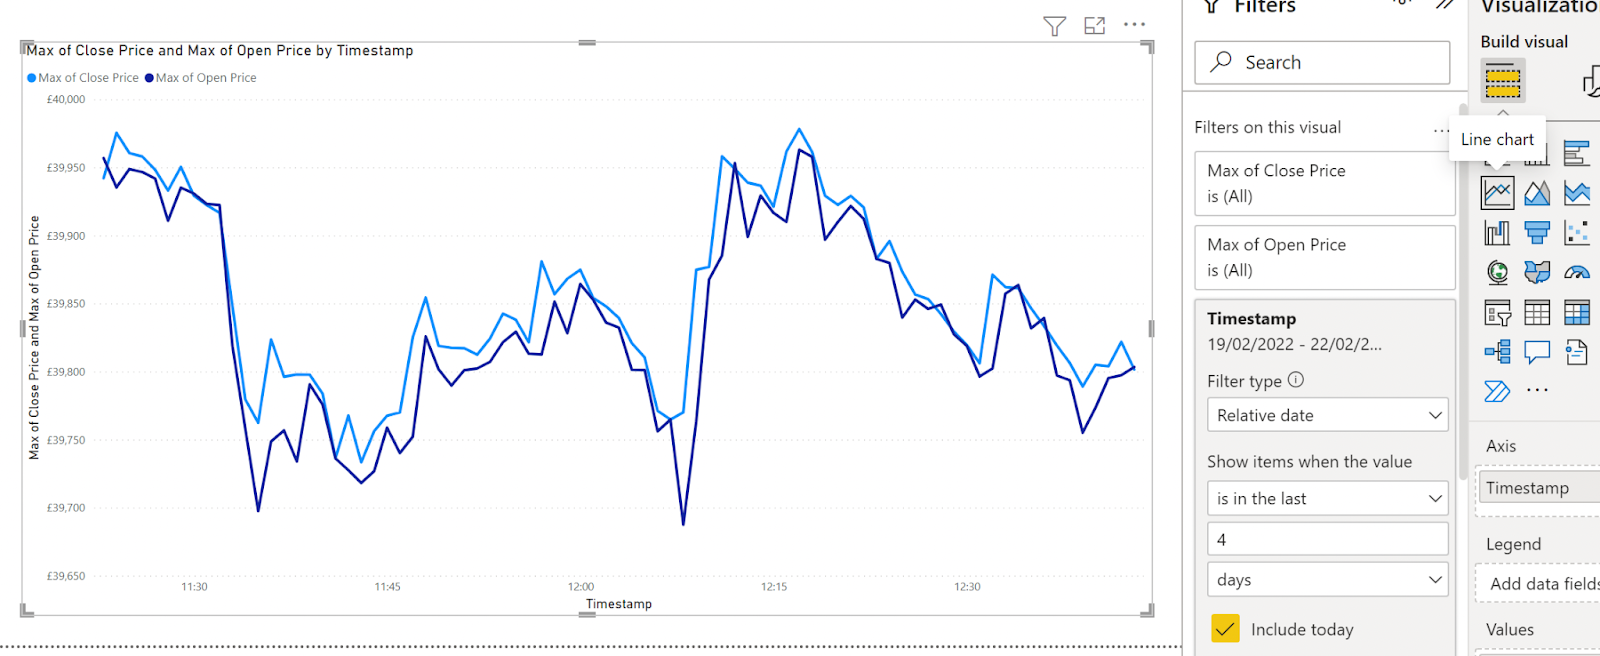
Finally, select the table in the report builder. Then, select the Line Chart option in the Visualizations section, like in the figure above.
Power BI then converts the table into a line chart showing the open and close price of BTC compared to USD over time.
Next Steps
We’ve pulled together all the pieces from the first two articles in the series to create a Power BI dashboard in this article. The dashboard reveals insights about data streamed into Cosmos DB via an Event Hub. To take this a step further, you could create a streaming data set in Power BI to update the report in real time as new data enters Cosmos DB.
The technologies we covered in this serieƒs provide the backbone for any real-time data system. The tools and techniques build an end-to-end serverless application that you can scale in Azure to meet demand as the data throughput grows. The system is also fault-tolerant, with multiple redundancy options available at the click of a button.
These solutions enable engineers to concentrate on building applications instead of managing infrastructure. They provide a sleeker engineering process while still preparing to scale up in the future.
Now that you know just how straightforward it is to create an end-to-end streaming solution using Azure Event Hubs, Azure Functions in Java, and CosmosDB, sign up for your free Azure account. Explore all the options to build your own unique real-time data analysis application.
To learn how to use Azure Cosmos DB change feed to understand user patterns, perform real-time data analysis and visualization, check out Use Azure Cosmos DB change feed to visualize real-time data analytics.
