Intel spearheaded the oneAPI industry initiative to eliminate weaknesses in programming models. The unified programming model helps improve the cross-platform development experience. It also unleashes the capabilities of different hardware components, such as central processing units (CPUs), graphics processing units (GPUs), and field-programmable gate arrays (FPGAs), to maximize the application performance of other architectural devices.
Intel has performance libraries that support the development process to make this possible. As developers, we are typically most familiar with the Intel® oneAPI Base Toolkit. However, this article discusses the capabilities of two other well-known tools, Intel® Advisor and Intel® VTune™ Profiler, that have cross-architecture profiling capabilities.
The Intel Advisor is a robust design and analysis tool to develop performant CPU and GPU code. It enables designing applications with better threading, vectorization, and memory use. Intel Advisor also helps identify where each part of the code runs optimally, the CPU or GPU. Arguably, this is its most helpful feature, but it also provides performance projections and straightforward recommendations to design fast GPU code.
Not to be outdone, the Intel VTune Profiler provides us with unique ways to maximize the performance of our apps and systems. It helps regulate the entire app’s performance both for the code running on the host and the accelerated portion. And, it is notably compatible with various programming languages.
Intel Advisor
While Intel Advisor provides many features, this article focuses on two, Offload Modeling and Roofline Analysis.
Offload Modeling
Offloading shifts pieces of code from one processor to another. The Offload Modeling feature helps identify elements of code running on the CPU that the GPU can more aptly manage. It finds specific loops to offload by matching the loop metrics with their source and the call tree. This approach maximizes performance by reducing loop overhead and using vectorization. Once it detects the problem, Intel’s Advisor runs an in-depth analysis of memory and the CPU. It provides a detailed description of each loop’s interference, including its total time and estimated time on accelerator offload, as well as data transfer rates and memory traffic. The Offload Modeling feature then predicts the potential speed increase by running the code using the GPU.
Additionally, the Offload Modeling feature finds potential performance bottlenecks, enabling us to decide on optimization options. It also checks how effectively data transfers between the host and target devices.

The above image shows how Intel Advisor identifies loops and functions that we can move to the GPU to improve performance. It also shows the total potential speed increase this change provides.
Roofline Analysis
The Roofline Analysis feature enables us to optimize our code for memory and computing. It provides a visual representation of application performance headroom concerning hardware limitations. Furthermore, Roofline Analysis helps us formulate a practical optimization roadmap by identifying high-impact optimization opportunities. It detects and prioritizes memory, cache, or computing bottlenecks and helps understand their causes by highlighting poor-performing loops and the factors responsible for blockages.
Finally, this feature provides a visualization of optimization progress. The X-axis describes the arithmetic intensity and the Y-axis measures performance in floating-point operations per second (GFLOPs). We can also select memory subsystems and arithmetic intensities to gauge our code’s performance.
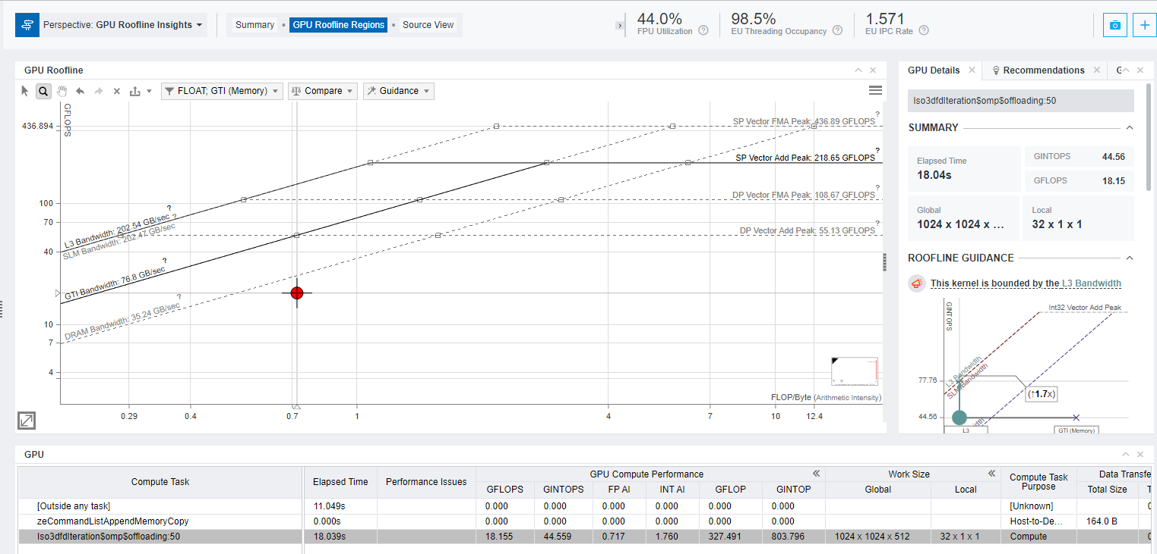
The above GPU roofline chart describes bottlenecks using dots. The red dot is the current performance for the given memory and hardware configurations. The roofs are maximum achievable performance, and the distance between the red dot and the roofs describes the performance headroom for the given GPU specifications.
This diagram helps us identify whether we must improve the cache performance, reduce the stall time between the data and CPU, or reduce the data transfer between CPU and GPU.
Intel VTune Profiler
Intel VTune Profiler tunes the GPU, CPU, and FPGA. It also helps to optimize offload performance by providing accurate data about the CPU, GPU, floating-point unit (FPU) threading, and memory bandwidth. This tool supports several languages, including data-parallel C++ (DPC++), C, C++, Fortran, Python, Go, and Java. This application makes bottlenecks easy to find.
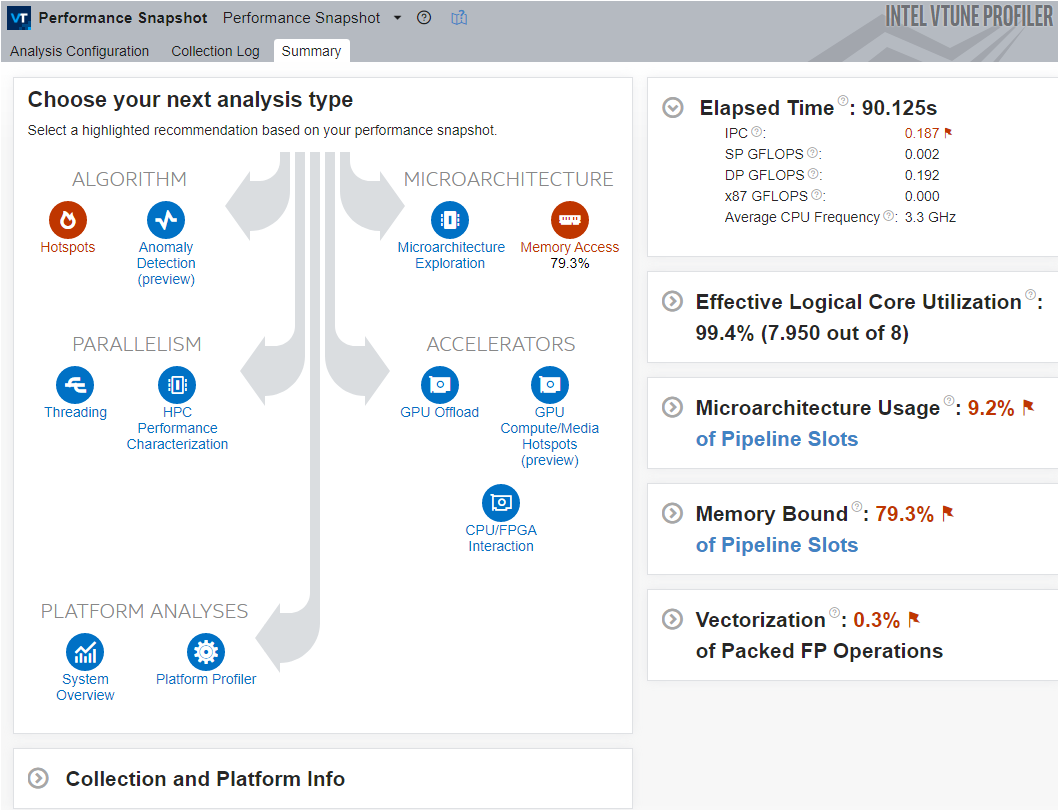
Intel VTune Profiler’s new feature, Performance Snapshot, suggests where to start. After a quick workload run, it offers various analysis types. This feature enables us to analyze a separate application at the system level.
Identifying Limits
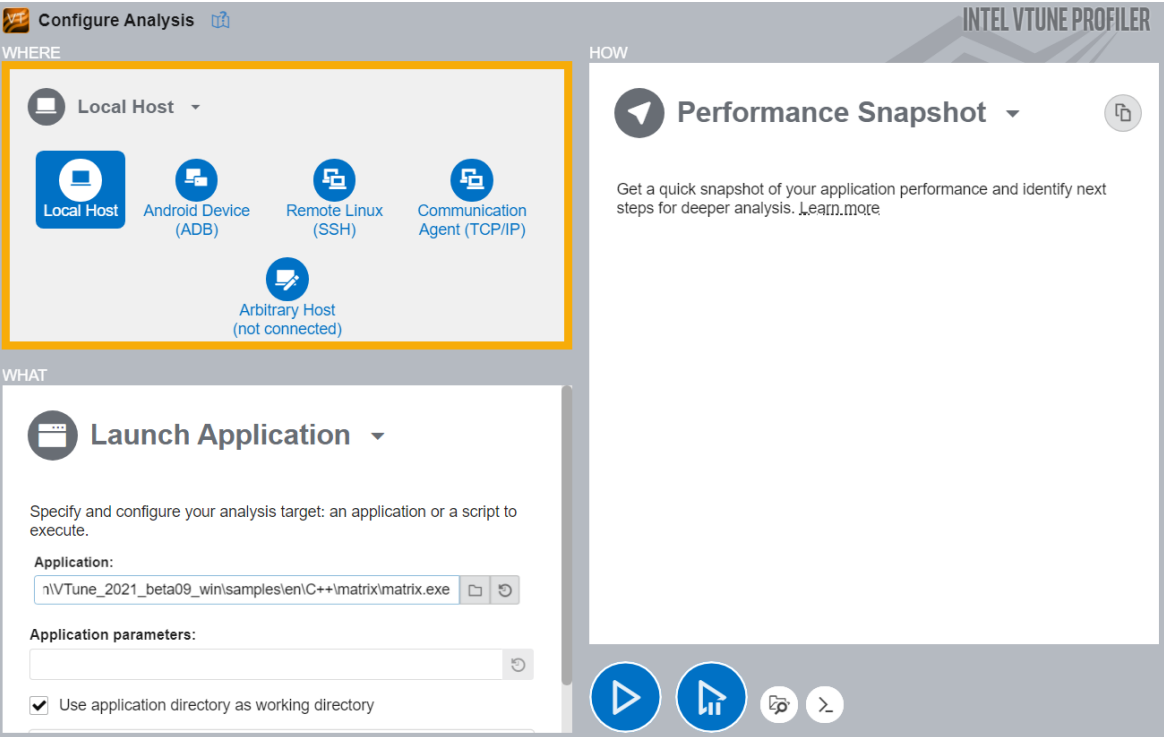
After performing a short analysis, Intel VTune Profiler displays various indices to help determine whether our application is CPU, GPU, or memory-bound. For example, if GPU use is 80 percent, the application is GPU-bound. We can configure this analysis by specifying the system, target, and type.
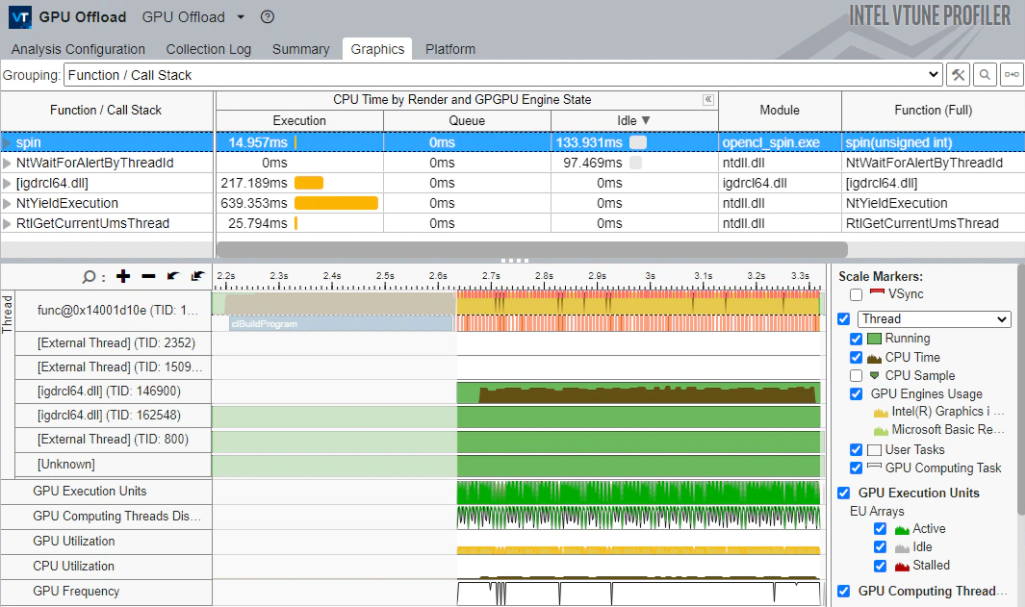
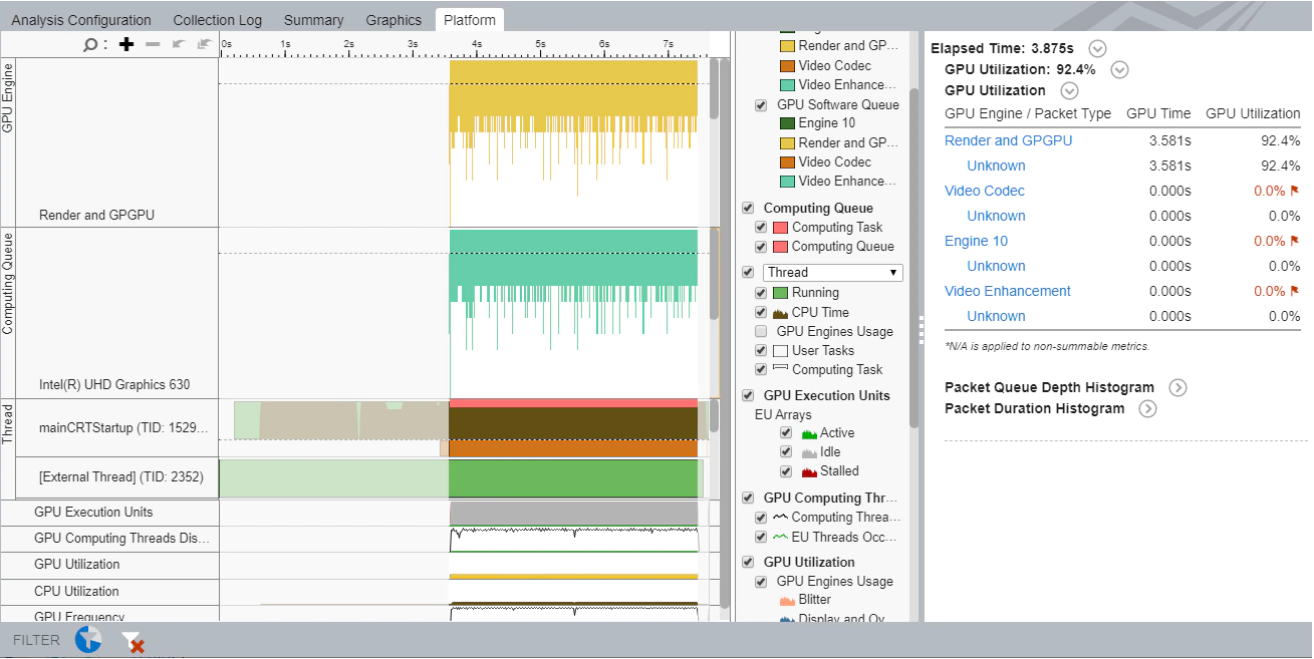
Intel VTune Profiler can analyze GPU task efficiency by underscoring critical hotspots and providing actionable recommendations about kernel issues. Additionally, the graphic feature that runs during analysis provides even more detailed information about task execution. The timeline view shows both GPU and CPU execution to help understand how much CPU or GPU the application or task uses when running.
Identifying Hotspots
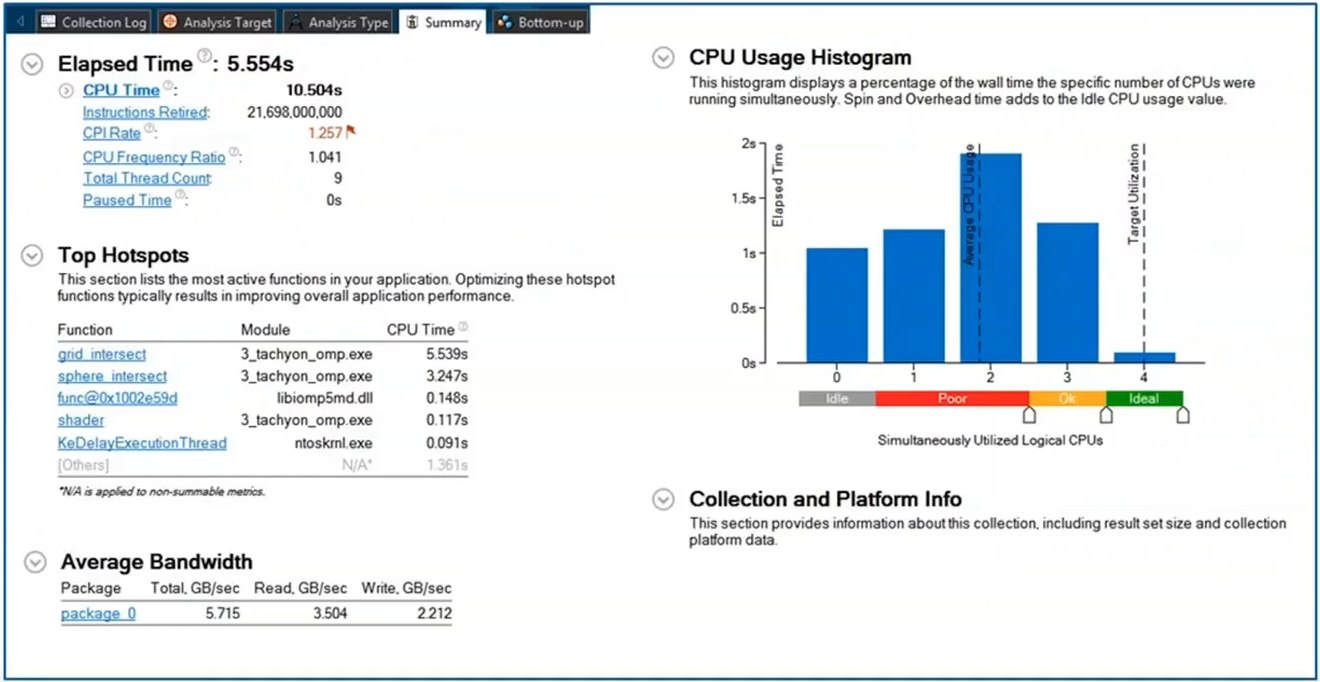
Furthermore, Intel VTune Profiler provides a Hotspot Analysis feature to highlight the area where the processor spends the most time. It also shows a histogram to compare CPU and GPU use.
The GPU Offload feature helps identify if the code offloaded to the GPU works effectively. It shows elapsed time, the most time-consuming GPU computing tasks, the job sizes, and their total duration. Additionally, it provides information about the GPU kernel’s time and helps uncover any problems related to memory latency or insufficient kernel algorithms.
This feature also provides a system diagram. We can view timeline, stalled execution units, computing threads, memory access, and bandwidths on the Platform tab. This information can help find (for example) high memory access and low execution unit problems, which we must resolve for optimization.
OneAPI Tools for Multiple Architectures
OneAPI focuses on supporting developers to improve code rather than learn new languages. However, the most significant feature of oneAPI-based applications is the ability to leverage Intel’s performance analysis tools to gain insight into hardware use and performance. We can then use this information to optimize and fine-tune code for multiple architectures.
Intel Advisor is highly effective at locating code that we can profitably move to the GPU. In addition, Intel Advisor categorizes top offloaded and non-offloaded regions so that we can focus on changes that result in actual performance gains. Furthermore, Intel Advisor’s Roofline analysis helps eliminate bottlenecks, and Intel VTune Profiler’s GPU offload features can significantly enhance GPU performance.
Overall, the combination of Intel Advisor’s efficiency-minded features and Intel VTune Profiler’s GPU-optimization capabilities provide an edge when fine-tuning our code to work in multiple architectures.
Use Cases
Intel’s oneAPI offers a simplified, unified programming model, endowing us with extreme flexibility. It can aid in developing a first-person shooter game or any software requiring graphics-intensive workloads.
It is essential to take advantage of user hardware to optimize performance. If the user’s GPU is powerful, Intel Advisor’s Offload Model identifies which parts of the application code can benefit from its processing power.
Additionally, Roofline Analysis helps to achieve the optimal performance for the host and accelerator.
Conclusion
The powerful OneAPI tool enables us to build potent applications without spending excessive time learning other languages. While it supports many performance optimization tools, we primarily focused on Intel Advisor and Intel VTune Profiler.
With the help of features like Offload Modeling, Roofline Analysis, and Hotspot Analysis, we gain a clearer picture of how to manage our code’s behavior and performance most effectively.
Finally, Intel’s oneAPI provides a comprehensive kit to suit a developer’s range of needs, from writing code that supports multiple architectures to improving performance at various levels. Explore oneAPI to experience just how effectively Intel Advisor and Intel VTune Profiler improve your application optimization processes.
