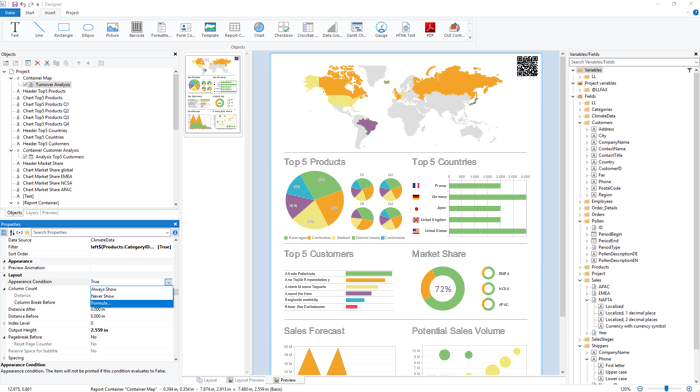
In this article, we'll take a closer look at List & Label and some of the key features and benefits, making it a great choice for developers looking to equip their applications with solid data visualization capabilities.
Introduction
Data visualization is a powerful strategy to help businesses and organizations make sense of complex data sets and make better-informed decisions. Whether you're looking to create a new app or improve an existing one, incorporating data visualization features will help you stand out from your competition and provide a more engaging and informative user experience.
How to Add Data Visualization Features to Your App
Data visualization is an essential part of almost any software application. As with many standard features, a time- and resource-saving alternative to adding your own is to use a ready-made software component. Choosing the right tool for the job can be challenging. One option worth considering is List & Label, a reporting tool specifically designed to be used with C# in Visual Studio.
In this article, we'll take a closer look at List & Label and some of the key features and benefits, making it a great choice for developers looking to equip their applications with solid data visualization capabilities.
About List & Label
List & Label is a reporting tool that allows developers to create, design and export various types of reports in different formats (e.g., PDF, Excel, Word, HTML). Data are derived from a wide range of sources, including the usual SQL database flavors, but also web formats like REST call results, XML and JSON. The tool is easy to use, with a user-friendly interface and a wide range of pre-built templates and components that can be customized to suit the specific needs of your application.
Data Visualization Options
List & Label provides a wide range of options for data visualization, including different chart types such as bar, pie, line, and scatter charts. Additionally, it also supports crosstab reports, displaying data in tabular format with rows and columns. The tool also provides the option to customize the appearance of charts and tables, allowing developers to create visually appealing and informative reports. There are lots of handy shortcuts, like converting charts to crosstabs and vice versa, or using drag & drop to intuitively build your reports. Reports can also be interactive, supporting both drill-down and drill-through.


Why Use List & Label for Your App?
There are many reasons why software developers might pick List & Label as their data visualization tool of choice.
One of the main benefits is its versatility and flexibility. It supports a wide variety of report types, including invoices, labels, lists, and charts, and it easily integrates into any application built with C#/.NET, using the same data your app already works with. Also, List & Label is not just a small part of a large component suite. The reporting functionality is thus fully in the focus and all development work flows into the continuous improvement and optimization of these core features.
Another key benefit of List & Label is its scalability. Whether you're working on a small project or a large enterprise application, the tool can be customized to meet your needs, it easily handles large amounts of data. The included Report Server works out of the box and has scalability built in at the core, using worker processes that can easily be distributed across multiple machines.
Conclusion
List & Label is a powerful and versatile data visualization tool that is well-suited for use in C#/.NET-based applications, both desktop and web. With its user-friendly interface, wide range of pre-built templates and components and its support for a variety of data sources and export formats, it is a great choice for software developers looking to add solid data visualization capabilities to their applications.
Compact Feature Overview, Online Demo and Trial
Feel free to get a feature overview of List & Label and other tools in this reporting tool comparison.
If you'd like to give List & Label a try, take a look at the Online Demo or download the free trial.
History
- 17th February, 2023: Initial version
