Introduction
I always hear from my juniors and QA' about a particular crash being easily reproduced at client machine and not being reproduced at their machines. This is a tricky problem, as developers cannot debug the crash at client's machine. The end result is endless communication between support team and the customer or even live meetings. Few smart programmers develop a crash logging system on their own to nail down the code which is causing the crash. Few others go over all places to implement try catch blocks generously in the code hoping to narrow down the problem.
Background
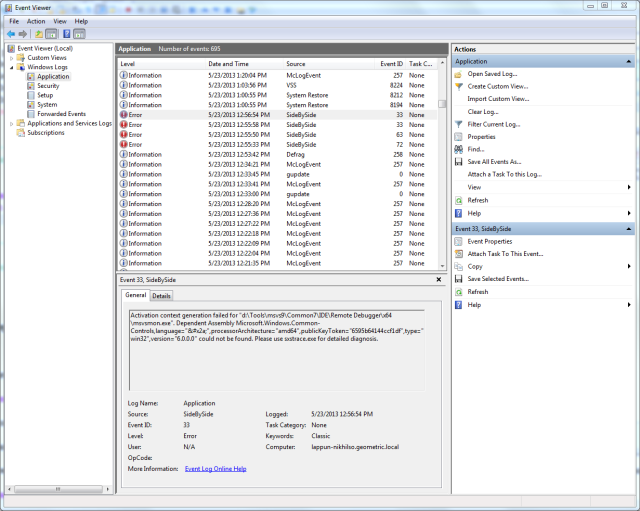
In recent years I have started using Event Viewer to check logs of various warnings, errors registered on a particular machine. I observed that an application or program crash is logged in the Application Event logs and has sufficient information to get hold of the crash or problem location most of the times. The event viewer is generally located at C:\Windows\system32\eventvwr.exe and once launched the Application event logs can easily be viewed.

Similar kind of information is shown to the user when a application or program crash takes place on a particular machine.
How to debug the crashes ?
To understand the event logger/viewer in a better and useful way, I decided to create a simple program which will crash when some specific command line parameter is passed to it.

The HowToFindCrashInExeCode.exe takes a number between 1 and 4 as a parameter and then accordingly crashes by generating appropriate exception. Number 1 and 3 generate Access Violation exception, whereas number 2 and 4 generate StackOverflow exception in the dependent DLL and main EXE respectively. The below two images show the crash report and the application event log when the program crashes on command line by using 1 as the input parameter.


The important details which the application event log gives us is Faulting application path, Faulting module name and path, Exception code and most importantly Faulting offset. The purpose of faulting application path, faulting module name and path is very obvious. The exception code reveals the detail and/or circumstances under which the crash occurred. The faulting offset is the memory location inside the loaded faulting module i.e. it gives us the exact crash location in the faulting module mentioned in the log. Once you get hold of the application event log from the customer, check the faulting module name, path and faulting offset, then launch the application on your machine and attach it to the debugger. Find the starting memory address of the loaded faulting module and add the faulting offset to this address. Then jump to memory address using the Disassembly. The Disassembly will exactly tell you the crash location. Isn't it a cool and quick way to nail down the crack. Above event manager log tells us that faulting module is HowToFindCrashInDLLCode.dll, exception code is 0xc0000005 which is access violation exception and faulting offset is 0x00001032. The following image depicts the disassembly of HowToFindCrashInDLLCode.dll along with the module load address.

The module load address is 0x73D60000, now add the faulting offset which is 0x00001032. The resulting memory address is 0x73D61032. After jumping to this memory location, you can see that crash comes from function crashForAccessViolation and the code which generates this crash is pVal[0] = 10; as pVal is integer pointer which is not instantiated.
Points of Interest
It is important to debug the same version/configuration/platform of the program on developer's machine to get the exact faulting location. Also if you have pdb's generated for your program then you can see the Disassembly as well as the source code once you jump to the faulting offset. No need of building the program with optimizations disabled as the faulting offset is universal for that program and developer needs to do some basic mathematics on his own. Sometimes the crash module is one of the system DLL, e.g., kernel.dll, nt.dll, or msvcr100.dll, then check the faulting offset the same way we did above and also check the exception code. These two things will help you to guess the problem in your code e.g. the STL or CRT libraries throw some exceptions like logical error, which sometimes generate unhandled exceptions and they get caught in the system DLL.
