Table of Contents
Many times, we would like to monitor events of WCF application in production environment. We would like to monitor events like errors, security audits, performance, etc. This can be achieved by extending the ASP.NET health monitoring system in WCF. The health monitoring system is also termed as instrumentation.
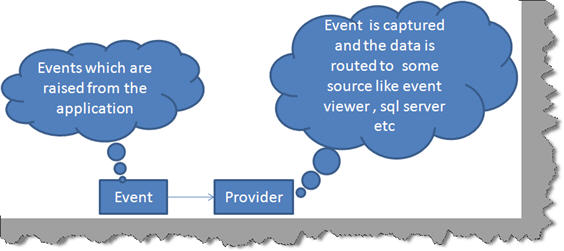
Instrumentation is provided using the event provider model. Events are notifications which you receive from the WCF application which can be a security event like password change, UI click events, or exception events like application level errors. These events are captured by the provider and routed to some source like event viewer, SQL Server, etc.

Both events and provider are specified in the web.config file. The eventMappings element is where you specify your provider and ‘rules’ elements help you tie up the event with the provider.
<healthMonitoring>
<eventMappings>...</eventMappings>
<rules>...</rules>
</healthMonitoring>
In this article, we will create a simple audit function which will help us to track all calls made to the WCF service in to event viewer. So any calls by the WCF client will be tracked and audited in to the event viewer. For every call, we will be tracking details like number of threads, working sets, app domains, when the message was created and when was it raised. Below is the snippet for the same which will be tracked in the event viewer.
***************start health monitoring event*******************
message created at:Event Created at :3/14/2010 11:32:37 AM
message raised at:Event Created at :3/14/2010 11:32:37 AM
Heap size 3480664
Number of threads 19
Number of Working sets 32165888
Number of domains 1
Request rejected 0******************End Health Monitoring event*********************
The first step is to create a class which will help us to track the calls made to the WCF service. This class needs to be inherited from WebAuditEvent class. This class helps us to track audit events, generate information about security related operation and provide both success and failure audit events.
using System;
using System.Collections.Generic;
using System.Linq;
using System.Text;
using System.Web.Management;

namespace healthmonitering
{
    public class CustomAudit:WebAuditEvent
    {
    }
}
In the same class, let's add 3 private fields, msgcreated , msgraised and WebProcessStatistics. By using msgcreated and msgraised, we can track at what time event is created and raised. WebProcessStatistics will provide information for assessing the health of a running process.
private string msgcreated = string.Empty;
private string msgraised = string.Empty;
private static WebProcessStatistics processStatistics;
Implement the necessary public constructors that call the protected equivalents in the parent WebAuditEvent class. Base keyword is used to access the member of base class within the derived class as shown in the below code snippet. Note that we have created the WebProcessStatistics object and set it to the private member variable.
public CustomAudit(string message, object eventsource, int eventcode)
       : base(message, eventsource, eventcode)
{
    msgcreated = string.Format("Event Created at :{0}", EventTime.ToString());
    processStatistics = new WebProcessStatistics();
}
In both the constructors, we are checking at what time event is created. Now override the Raise method as shown in the below code snippet.
public override void Raise()
{
    msgraised = string.Format("Event Created at :{0}", EventTime.ToString());
    base.Raise();
}
Override the FormatCustomEventDetails method with the message we want to log in the event viewer. Note, we have used WebProcessStatistics to get information like heap size, number of threads, number of working sets, number of domains and Request rejected.
public override void FormatCustomEventDetails(WebEventFormatter formatter)
{
    formatter.AppendLine("");
    formatter.IndentationLevel += 1;
    formatter.AppendLine
	("***************start health monitoring event*******************");
    formatter.AppendLine(string.Format("message created at:{0}",msgcreated));
    formatter.AppendLine(string.Format("message raised at:{0}", msgraised));
    formatter.AppendLine(string.Format
	("Heap size {0}", processStatistics.ManagedHeapSize.ToString()));
    formatter.AppendLine(string.Format
	("Number of threads {0}", processStatistics.ThreadCount.ToString()));
    formatter.AppendLine(string.Format
	("Number of Working sets {0}", processStatistics.WorkingSet.ToString()));
    formatter.AppendLine(string.Format
	("Number of domains {0}", processStatistics.AppDomainCount.ToString()));
    formatter.AppendLine(string.Format
	("Request rejected {0}", processStatistics.RequestsRejected.ToString())); ;
    formatter.AppendLine
	("******************End Health Monitoring event*********************");
    formatter.IndentationLevel -= 1;
}
In the Raise method, we are checking at what time event raised and in FormatCustomEventDetails, we are appending the result in the audit event.
namespace WcfService3
{
    [ServiceContract]
    public interface IService1
    {
        [OperationContract]
        string Audit();
    }
}
In the Audit function, we are going to implement our health monitoring functionality in health operation contract.
In the Service1.svc.cs class, implement the Audit function by creating the CustomAudit object and calling the Raise function as shown in the below code snippet:
public class Service1 : IService1
{
    public string Audit()
    {
        Healthmonitering.CustomAudit webevent =
		new Healthmonitering.CustomAudit("Some on called",
                    this, WebEventCodes.WebExtendedBase + 1);
        webevent.Raise();
        return "Event Audited";
    }
}
In the constructor, we are sending message, event source, and event code as a parameter.
Now go to the web.config and under system.web element, add the healthmonitoring tag. Specify CustomAudit class in the eventMappinga element and mapping of the class with event viewer in the rules element tag as shown in the below code snippet.
<healthMonitoring>
<eventMappings>
<add name="healthmonitering" type="Healthmonitering.CustomAudit "/>
</eventMappings>
<rules>
<add name="healthmonitering" eventName="healthmonitering"
	provider="EventLogProvider" minInterval="00:00:01"/>
</rules>
</healthMonitoring>
So let’s add an ASPX button, consume the client service and call the Audit function in the button click event as shown in the below code snippets:
<asp:Button ID="Button1" runat="server" Text="Invoke" onclick="Button1_Click" />
Now in the button click event, write these lines:
protected void Button1_Click(object sender, EventArgs e)
{
    ServiceReference1.Service1Client proxy =
		new WebApplication1.ServiceReference1.Service1Client();
    string result = proxy.Audit();
    Response.Write(result);
}
Here we are creating the proxy, invoking the Audit method and displaying the result of the Audit method.
Run the web application which is consuming the WCF service and press the button to invoke the WCF audit function. The Audit function internally calls the Raise event which logs the message in an event viewer. So go to Start->run->type eventvwr. It contains information like Heap size, Number of threads, Number of Working sets, Number of domains and Request rejected as shown in the below figure:

