Introduction
This post is about locating the exact location of the Exception in the code. There is always a problem for the developer to locate the exact location from where Exception was raised, because of that, it is difficult for the developer what actually went wrong. Most of the time, problem occurs when there are too many libraries referenced, i.e., used in project.
To understand, let’s consider the below example: In the following example, the application is divided in three layers.
- Font end - Layer though which user interacts with application and displays data to end user of application.
- Business - Layer which has the business logic, code to call
datalayer and the info classes which transport between font and data layer. - Data - Layer which interacts with database and supplies data to business layer.
Front Layer Code
class Program
{
public int i = 10;
public static void Main(string[] args)
{
try
{
(new BusinessEmployee()).GetEmployeeList();
}
catch (Exception ex)
{
global::System.Windows.Forms.MessageBox.Show(ex.Message);
}
}
}
As you see in the above code Font layer is calling “GetEmployeeList” method to get list of all employee.
BusinessLayer Code
public class BusinessEmployee
{
private readonly DataEmployee dataEmployee;
public BusinessEmployee()
{
dataEmployee = new DataEmployee();
}
public void GetEmployeeList()
{
dataEmployee.GetEmployeeList();
}
}
In this layer, the Business class is calling DataLayer to get employee list from the database.
DataLayer Code
public class DataEmployee
{
public void GetEmployeeList()
{
throw new Exception("Not able to fetch employee");
}
}
This layer returns employee list, but for the example, it's returning exception.
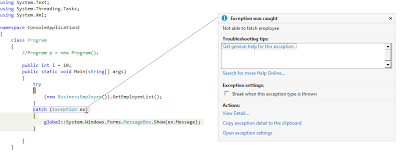
Now if you run the above code by putting it into the respected layer, then when exception is thrown by the actual code, debugger breaks execution in the front layer code. The below image shows the same thing.

So it becomes difficult for the developer what went wrong if there is actual complex code.
Solution
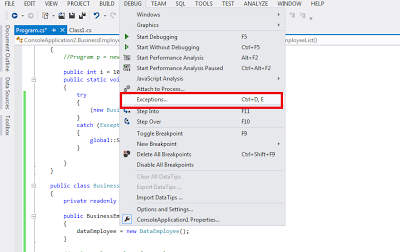
In Visual Studio, there is an option as given in the below image that allows to break debugging at the point, i.e., at the code from where exception is coming.

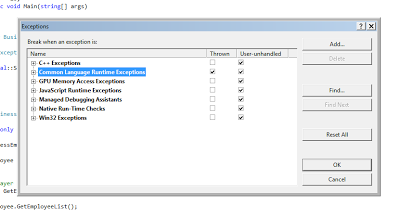
Once you clicked on menu option, it will open up dialog box where you can mark tick on “Common Language Runtime Exception” as in the below image and click ok.

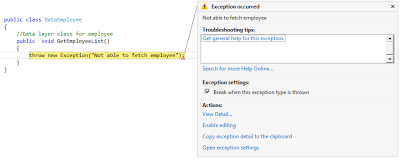
Now if you run the same code, then the debugger will stop at the exact location from where exception is coming, you can also see the below image.

So breaking at exact location from where error is coming, you can find out which part is actually causing the problem and help to resolve the error easily.
Conclusion
Visual Studio option to locate exception is also very helpful when there are multiple threads doing operation and throws exception. Also locate exceptions dialog provides other option that are also helpful when you are using JavaScript, com component, etc. that you can try by yourself.
