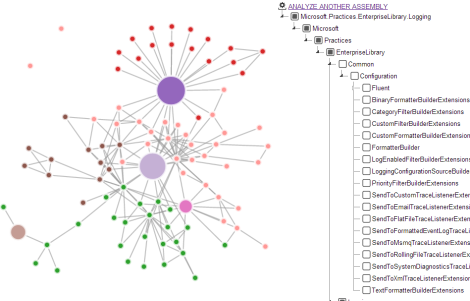
Dependency graph is a great visual way to examine code and understand the code base without having to look through it.
There are a number of powerful tools like Visual Studio Ultimate Dependency Graphs or ndepend especially for .NET code.
Our tool is a less sophisticated and less scientific way of viewing dependencies. Therefore it is more simple, intuitive and gives you a better feeling of what “belongs together” and where are the natural boundaries between components.
The Idea
We generate a dependency graph out of .NET assemblies, put it into a “force field” and see how nodes, representing types are wobbling around, until they found their “natural” places.

…and it’s interactive. You can poke your code dependencies:
- Hover nodes to see details
- Click namespace nodes to burst them
- Try to drag nodes and see how much will be “taken along”
- Expand/collapse the tree, expand/collapse a subtree tree using context menu
- Check/uncheck tree nodes to highlight them on the graph
- Use mouse wheel to zoom, drag the surface to pan
Usage
There are two executables. The first one codevis.exe generates dependency graphs out of assemblies and saves them into json files. Another one Gma.CodeVisuals.WebApi.exe is for visualization, which hosts a HTML5 site on port 8080 and launches the browser.
You can generate dependencies out of one or several assemblies. Note that if you generate one graph out of several assemblies, it will also include inter-assembly dependencies, dependencies between types located in different assemblies.
Examples:
> codevis.exe C:\Framework\System.Core.dll
> codevis.exe C:\Framework\System.Data*
> codevis.exe MyAssembly System.Core System.Linq -p:C:\framework\;c:\myfolder
Assembly names must be separated by spaces. The ‘.dll’ or ‘.exe’ extension can be omitted. Wildcards can be used in names. You have also a choice between using absolute paths with every assembly or specifying short assembly names together with search directories using the -p option.
Implementation
For dependency graph generation, we use .NET reflection and a library by Roy Osherove which has been originally adapted from Microsoft’s sample code for a DynamicMethod Visualizer.
Visualization is done using a very powerful and beautiful library named D3 Data-Driven Documents. The CodeFlower visualizer, which is also d3js based and visualizes code base by means of LOCs, delivered us a good starting point.
Future
The project is hosted at https://github.com/floriangreinacher/codegravity. It is open source. Except improving the dependency graph usability, we will probably add some other intuitive code metric visualizations. Currently, I am playing with the idea to migrate my Code Word Cloud Generator into d3js and HTML5.
One More Thing
I personally liked the idea of Web API and HTML5 site hosted in one EXE very much. All you need is the reusable class WebServerOnFolder (under $\Gma.CodeVisuals.WebApi\Server\WebServerOnFolder.cs) and the ASP.NET Web API Self Host nuget package.


