Introduction
This is a demonstration that shows how the GNU Java Expressions Library (JEL) can be used in your project to compile (rather than interpret) string representations of algebraic expressions. Compiling expressions at runtime with JEL is very efficient compared to parse/interpret approaches and has applications well beyond the algebraic evaluation task demonstrated here.
Say you want your user to be able to enter an algebraic function as a string and then have your application evaluate that function at runtime. One common approach is to parse the expression and interpret it as it occurs. Another approach that avoids the performance penalties associated with interpreters is to compile the expression into Java bytecode. Enter the Java Expressions Library (JEL) that is provided by the GNU Project.
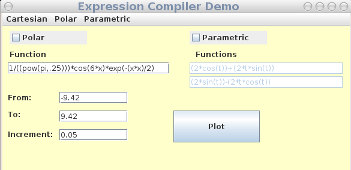
The demo application provides a window with a text field where the user can enter a function as a string. It also has boxes for entering the minimum and maximum domain values to be evaluated, as well as a box for entering the increment to be used in synthesizing the set of domain values. Simply clicking the Plot button shows the graph. Fifty five example functions are provided in the menus.
The example is intentionally simple. In the interest of providing coders with an undistracting example, I avoided complicating the code with ancillary features and prudent error management (it won't gracefully handle typographical errors). For no-frills graphing, I used a simple plotting class (Plot.java) provided by Dr. Daniel Schroeder at Weber State University. If you use this plotting class in your projects, it has a copyright which carries a non-commercial use restriction and requires proper citation. The other three classes and the JEL library are free, open source, GNU-licensed software. The application as a whole inherits this site's CPOL license.
Background
The GNU Java Expressions Library is a substantial resource for Java programmers. Last updated in 2007, it remains a very relevant solution with capabilities well beyond the scope of my example. It was developed by Dr. Konstantin Metlov who is currently a Senior Scientist at the Donetsk Institute for Physics and Technology. After browsing through the source code and using the library, I am convinced that JEL is more efficient than any code I might struggle to write myself and, having it in my toolbox, frees me to focus on my primary interests. It is well documented, both within the Java classes themselves and on the project's manual and API pages.
Trying the Demo
You will need to have an updated Java Runtime Environment to run the application. If you haven't updated Java to 1.7, then do so. Download the demo it and unzip it. This will create a folder in your downloads directory named runnableDemo, which will contain the Java executable jelDemo.jar side-by-side with the necessary libraries. From the command line, change to the folder that contains jelDemo.jar (runnableDemo folder ) and run:
java -jar jelDemo.jar
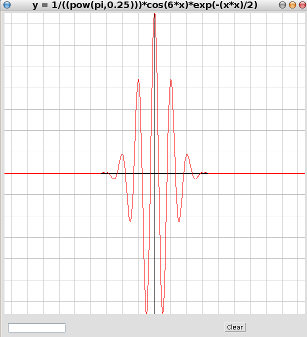
The application starts with an example already filled into the parameter boxes. Simply clicking Plot will show the graph.

Before trying your own expressions, test a few of the examples in the menu to get a feeling for the expression syntax.
The default function is the real part of the Morlet wavelet.

For a simpler example, choose Menu -> Cartesian ->
Line. This will automatically load the corresponding example parameters in the boxes.
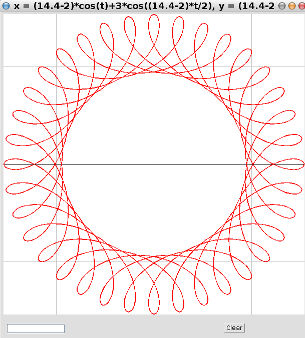
My favorite is the Hypocycloid (1) example:

The code
Unzipping the source download will create a CompilePlotSrc folder in your downloads directory. It contains a LicenseInfo.txt file, an EclipseHowTo.txt file, the source code folder (src), and a convenience copy of the jel-2.0.1 library in a subfolder..
Before you can compile the source code you will need to link to the jel-2.0.11 library. The EclipseHowTo.txt file briefly explains how to do this using the Eclipse IDE.
MainForm.java class
The entry point for the application is the main() method of the MainForm.java class. When started, the MainForm class presents a jFrame with a text fields, check boxes, menus, and a plot button. The class has a few properties with global scope:
public String function = "";
public String functionTx = "";
public String functionTy = "";
public String label = "";
public double xMin;
public double xMax;
public double dx;
public boolean isPolar = false;
public boolean isParametric = false;
As an example, let's say we have a function, y = sin(x) that we want to evaluate from x = -10 to x = 10 in increments of 0.01. In this case:
- function = sin(x)
- xMin = -10
- xMax = 10
- dx = 0.01
- isPolar = false (Although we could understand the function as polar and the plot will will be a perfect circle.)
- y = sin(x) is a not a parametric equation so isParametric = false. Consequently, functionTx and functionTy are not used.
- label can be any string you choose
The MainForm's principal jFrame is
frmExpressionCompilerDemo, which has controls (jTextFields and jCheckBoxes) in which the above values are entered. When the
Plot button is clicked, the getText() method collects the values from the controls and uses them as parameters in calls to methods in the next class we will discuss: the Helper.java class.
Helper.java class
The Helper class exposes only two public methods: Plot() and PlotParametric(). I will focus on the non-parametric case for the remainder of this article. The parametric case follows a parallel logic. Plot() takes the following parameters: the string representation of the function, the domain's min, max, and increment values, the label, and the isPolar boolean.
Here is the Plot() method in the Helper class:
public static void Plot(String function, double xMin, double xMax,
double dx, boolean isPolar, String label) {
double[] x = SamplingFn(xMin, xMax, dx);
double[][] xy = EvaluateFunction(function, x, isPolar);
Plot(xy[0], xy[1], label);
} Three things happen in the method:
- The MainForm collects a specification for the x values from the user that consists only of a minimum x value, a maximum x value, and the incremental difference between individual values. Having an array populated with the entire set of x values is more convenient for processing. A double[] that contains the specified x values is obtained by calling the SamplingFn() method.
- The actual expression evaluation work is performed by the EvaluateFn() method, which returns a 2-D array: double[][] xy, where xy[0] are the x values and xy[1] are the y values.
- Finally, the xy array is submitted to the Plot() method, which creates an instance of the PlotForm class presenting the function's graph.
The important step is Step 2, where we evaluate the expression at the domain points contained in the array of x values. EvaluateFn() calls the Compile() method to obtain an array of y = f(x) values, then packs the result together with the original x values in a double[][]. The Compile() method implements the interface with JEL. Below is the Compile() method's code, which is a minor adaptation of example code from the JEL documentation.
public static double[] Compile(double[] x, String expr)
throws CompilationException {
int n = x.length;
double[] fX = new double[n];
Class[] staticLib = new Class[1];
try {
staticLib[0] = Class.forName("java.lang.Math");
} catch (ClassNotFoundException e) {
System.out.print("1");
}
Class[] dynamicLib = new Class[1];
VariableProvider variables = new VariableProvider();
Object[] context = new Object[1];
context[0] = variables;
dynamicLib[0] = variables.getClass();
Library lib = new Library(staticLib, dynamicLib, null, null, null);
CompiledExpression expr_c = null;
try {
expr_c = Evaluator.compile(expr, lib);
} catch (CompilationException ce) {
System.err.print("--- COMPILATION ERROR :");
System.err.println(ce.getMessage());
System.err.print(" ");
System.err.println(expr);
int column = ce.getColumn();
for (int i = 0; i < column + 23 - 1; i++)
System.err.print(' ');
System.err.println('^');
}
if (expr != null) {
try {
for (int i = 0; i < n; i++) {
variables.xvar = x[i];
fX[i] = (double) expr_c.evaluate(context);
}
} catch (Throwable e) {
System.err.println("Exception emerged from JEL compiled"
+ " code (IT'S OK) :");
System.err.print(e);
}
}
return fX;
}
What is the fourth class, VariableProvider.java? It's the class that enables us to pass the array values, x[i], to the compiler in such a fashion that they substitute for the occurrences of "x" in the expression string. Here is the relevant part of VariableProvider:
public class VariableProvider {
public double xvar;
public double tvar;
public double picon = Math.PI;
public double x() {
return xvar;
};
public double t() {
return xvar;
};
public double pi() {
return picon;
};
} Points of Interest
The Java Expressions Library has many powerful capabilities beyond the scope of this article. It can be used in a rich variety of cases, essentially whenever you want your program to execute compiled instructions at runtime using string representations of objects, types, operators, etc. (See the other features ). A major benefit of choosing JEL for programmatic access to string representations of algebraic expressions is that JEL's capabilities are not confined to that task alone. Because it is a generalized expression evaluator, it provides not just a tool, but a whole box of tools.
Graphs present functions with remarkable clarity, quite often providing insights that are inaccessible by inspection of their typographical representations. Frequently functions are better understood (and more easily expressed) when they are represented in polar and/or parametric form. The PlotParametric() and PolarToCart() methods in the Helper.java class handle the computations for creating (Cartesian-based) data arrays from polar and parametric solution sets. Although we're not constrained to think inside of a Cartesian box, reducing all functions to the Cartesian equivalents is convenient for creating visualizations.
As a lad I remember seeing the graphs for various functions (Cartesian, polar, and parametric) in a now collectible edition of the CRC Handbook of Chemistry and Physics. Today, there are many on-line atlases of plotted functions, quite often presented together with programming examples in syntax specific to myriad commercial mathematics software packages (example). With certainty, some of them have sophisticated, closed-source expression compilers.
History
Keep a running update of any changes or improvements you've made here.
