Read the first part of the article if you haven’t done so already. Part 1 has a brief overview of what GC is and how it performs its magic. It contains a test of GC performance with regards to large array of bytes. You can also find there a detailed information about my test environment…
This part will focus on scenarios which put a lot more pressure on GC and appear more commonly in real world applications. You will see that even a tree of more than 100 million objects can be handled quickly… But first let’s see how GC responds to big array of type object:
static void TestSpeedForLargeObjectArray()
{
Stopwatch sw = new Stopwatch();
Console.Write(string.Format("GC.GetTotalMemory before creating array: {0:N0}.
Press key any to create array...", GC.GetTotalMemory(true)));
Console.Read();
object[] array = new object[100 * 1000 * 1000];
sw.Start();
for (int i = 0; i < array.Length; i++)
{
array[i] = new object();
}
Console.WriteLine("Setup time: " + sw.Elapsed);
Console.WriteLine(string.Format("GC.GetTotalMemory after creating array: {0:N0}.
Press Enter to set array to null...", GC.GetTotalMemory(true)));
if (Console.ReadKey().Key == ConsoleKey.Enter)
{
Console.WriteLine("Setting array to null");
array = null;
}
sw.Restart();
GC.Collect();
Console.WriteLine("Collection time: " + sw.Elapsed);
Console.WriteLine(string.Format("GC.GetTotalMemory after GC.Collect: {0:N0}.
Press any key to finish...", GC.GetTotalMemory(true)));
Console.WriteLine(array);
Console.ReadKey();
}
The above test creates an array of 100 million items. Initially, such array takes about 800 megabytes of memory (on x64 platform). This part is allocated on LOH. When object instances are created, total heap allocation jumps to 3.2 GB. Array items are tiny so they are part of Small Object Heap and initially belong to Gen 0.
Here are the test results for situations when array is set to null:
GC.GetTotalMemory before creating array: 41,736. Press key any to create array...
Press any key to fill array...
Setup time: 00:00:07.7910574
GC.GetTotalMemory after creating array: 3,200,057,616. Press Enter to set array to null...
Setting array to null
Collection time: 00:00:00.7481998
GC.GetTotalMemory after GC.Collect: 57,624. Press any key to finish...
It took only about 700 ms to reclaim over 3 GB of memory!
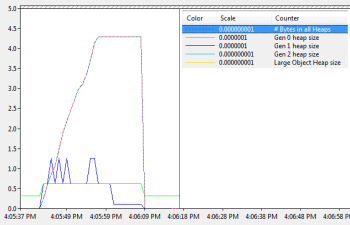
Take a look at this graph from Performance Monitor:
![Managed memory counters for large object[] array; setting array to null... Click to enlarge...](/KB/dotnet/788382/PerfMonObjectArray_small.png)
You can see that while program was filling the array, Gen 0 and Gen 1 changed size (notice though that the scale for these is 100x bigger than scale for other counters). This means that GC cycles were triggered while items were created - this is expected behavior. Notice how Gen 2 and LOH size adds up to total bytes on managed heap.
What if instead of setting array reference to null, we set array items to null?
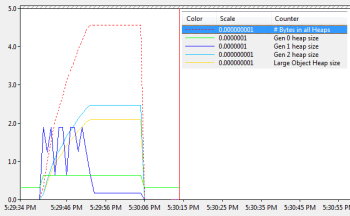
Let’s see. Here’s the graph:
![Managed memory counters for large object[] array; setting array items to null... Click to enlarge...](/KB/dotnet/788382/PerfMonObjectArrayElements_small.png)
Notice that after GC.Collect is done 800 MB are still allocated - this is LOH memory held by array itself…
Here are the results:
GC.GetTotalMemory before creating array: 41,752. Press key any to create array...
Press any key to fill array...
Setup time: 00:00:07.7707024
GC.GetTotalMemory after creating array: 3,200,057,632.
Press Enter to set array elements to null...
Setting array elements to null
Collection time: 00:00:01.0926220
GC.GetTotalMemory after GC.Collect: 800,057,672. Press any key to finish...
Ok, enough with arrays. One can argue that as continuous blocks of memory, they are easier to handle than complex objects structures that are abundant in real word programs.
Let’s create a very big tree of small reference types:
static int _itemsCount = 0;
class Item
{
public Item ChildA { get; set; }
public Item ChildB { get; set; }
public Item()
{
_itemsCount++;
}
}
static void AddChildren(Item parent, int depth)
{
if (depth == 0)
{
return;
}
else
{
parent.ChildA = new Item();
parent.ChildB = new Item();
AddChildren(parent.ChildA, depth - 1);
AddChildren(parent.ChildB, depth - 1);
}
}
static void TestSpeedForLargeTreeOfSmallObjects()
{
Stopwatch sw = new Stopwatch();
Console.Write(string.Format("GC.GetTotalMemory before building object tree: {0:N0}.
Press any key to build tree...", GC.GetTotalMemory(true)));
Console.ReadKey();
sw.Start();
_itemsCount = 0;
Item root = new Item();
AddChildren(root, 26);
Console.WriteLine("Setup time: " + sw.Elapsed);
Console.WriteLine("Number of items: " + _itemsCount.ToString("N0"));
Console.WriteLine(string.Format("GC.GetTotalMemory after building object tree: {0:N0}.
Press Enter to set root to null...", GC.GetTotalMemory(true)));
if (Console.ReadKey().Key == ConsoleKey.Enter)
{
Console.WriteLine("Setting tree root to null");
root = null;
}
sw.Restart();
GC.Collect();
Console.WriteLine("Collection time: " + sw.Elapsed);
Console.WriteLine(string.Format("GC.GetTotalMemory after GC.Collect: {0:N0}.
Press any key to finish...", GC.GetTotalMemory(true)));
Console.WriteLine(root);
Console.ReadKey();
}
The test presented above creates a tree with over 130 million nodes which take almost 4.3 GB of memory.
Here’s what happens when tree root is set to null:
GC.GetTotalMemory before building object tree: 41,616. Press any key to build tree...
Setup time: 00:00:14.3355583
Number of items: 134,217,727
GC.GetTotalMemory after building object tree: 4,295,021,160. Press Enter to set root to null...
Setting tree root to null
Collection time: 00:00:01.1069927
GC.GetTotalMemory after GC.Collect: 53,856. Press any key to finish...

It took only 1.1 second to clear all the garbage! When root reference was set to null, all nodes below it became useless as defined by mark and sweep algorithm… Notice that this time, LOH is not utilized as no single object instance is over 85 KB threshold.
Now let’s see what happens when the root is not set to null and all the objects survive GC cycle:
GC.GetTotalMemory before building object tree: 41,680. Press any key to build tree...
Setup time: 00:00:14.3915412
Number of items: 134,217,727
GC.GetTotalMemory after building object tree: 4,295,021,224. Press Enter to set root to null...
Collection time: 00:00:03.7172580
GC.GetTotalMemory after GC.Collect: 4,295,021,184. Press any key to finish...
This time, it took 3.7 sec (less than 28 nanoseconds per reference) for GC.Collect to run – remember that reachable references put more work on GC than dead one!
There is one more scenario we should test. Instead of setting root = null let's set root.ChildA = null. This way, half of the tree would became unreachable. GC will have a chance to reclaim memory and compact it to avoid fragmentation. Check the results:
GC.GetTotalMemory before building object tree: 41,696. Press any key to build tree...
Setup time: 00:00:15.1326459
Number of items: 134,217,727
GC.GetTotalMemory after creating array: 4,295,021,240. Press Enter to set root.ChildA to null...
Setting tree root.ChildA to null
Collection time: 00:00:02.5062596
GC.GetTotalMemory after GC.Collect: 2,147,537,584. Press any key to finish...
Time for final test. Let’s create a tree of over 2 million complex nodes that contain some object references, small array and unique string. Additionally, let's fill some of the MixedItem instances with byte array big enough to be put on Large Object Heap.
static int _itemsCount = 0;
class MixedItem
{
byte[] _smallArray;
byte[] _bigArray;
string _uniqueString;
public MixedItem ChildA { get; set; }
public MixedItem ChildB { get; set; }
public MixedItem()
{
_itemsCount++;
_smallArray = new byte[1000];
if (_itemsCount % 1000 == 0)
{
_bigArray = new byte[1000 * 1000];
}
_uniqueString = DateTime.Now.Ticks.ToString();
}
}
static void AddChildren(MixedItem parent, int depth)
{
if (depth == 0)
{
return;
}
else
{
parent.ChildA = new MixedItem();
parent.ChildB = new MixedItem();
AddChildren(parent.ChildA, depth - 1);
AddChildren(parent.ChildB, depth - 1);
}
}
static void TestSpeedForLargeTreeOfMixedObjects()
{
Stopwatch sw = new Stopwatch();
Console.Write(string.Format("GC.GetTotalMemory before building object tree: {0:N0}.
Press any key to build tree...", GC.GetTotalMemory(true)));
Console.ReadKey();
sw.Start();
_itemsCount = 0;
MixedItem root = new MixedItem();
AddChildren(root, 20);
Console.WriteLine("Setup time: " + sw.Elapsed);
Console.WriteLine("Number of items: " + _itemsCount.ToString("N0"));
Console.WriteLine(string.Format("GC.GetTotalMemory after building object tree: {0:N0}.
Press Enter to set root to null...", GC.GetTotalMemory(true)));
if (Console.ReadKey().Key == ConsoleKey.Enter)
{
Console.WriteLine("Setting tree root to null");
root = null;
}
sw.Restart();
GC.Collect();
Console.WriteLine("Collection time: " + sw.Elapsed);
Console.WriteLine(string.Format("GC.GetTotalMemory after GC.Collect: {0:N0}.
Press any key to finish...", GC.GetTotalMemory(true)));
Console.WriteLine(root);
Console.ReadKey();
}
How will GC perform when subjected to almost 4.5 GB of managed heap memory with such complex structure? Test results for setting root to null:
GC.GetTotalMemory before building object tree: 41,680. Press any key to build tree...
Setup time: 00:00:11.5479202
Number of items: 2,097,151
GC.GetTotalMemory after building object tree: 4,496,245,632. Press Enter to set root to null...
Setting tree root to null
Collection time: 00:00:00.5055634
GC.GetTotalMemory after GC.Collect: 54,520. Press any key to finish...

And in case you wonder, here's what happens when root is not set to null:
GC.GetTotalMemory before building object tree: 41,680. Press any key to build tree...
Setup time: 00:00:11.6676969
Number of items: 2,097,151
GC.GetTotalMemory after building object tree: 4,496,245,632. Press Enter to set root to null...
Collection time: 00:00:00.5617486
GC.GetTotalMemory after GC.Collect: 4,496,245,592. Press any key to finish...
So what it all means? The conclusion is that unless you are writing applications which require extreme efficiency or total guarantee of uninterrupted execution, you should be really glad that .NET uses automatic memory management. GC is a great piece of software that frees you from mundane and error prone memory handling. It lets you focus on what really matters: providing features for application users. I’ve been professionally writing .NET applications for the past 8 years (enterprise stuff, mainly web apps and Windows services) and I’m yet to witness1 a situation when GC cost would be a major factor. Usually, performance bottleneck lays in things like: bad DB configuration, inefficient SQL/ORM queries, slow remote services, bad network utilization, lack of parallelism, poor caching, sluggish client side rendering, etc. If you avoid basic mistakes like creating too many strings you probably won’t even notice that there is a Garbage Collector :)
Update 31.08.2014: I've just run the most demanding test (big tree of small reference types with all objects surviving GC cycle) on my new laptop. The result is 3.3s compared to 3.7s result presented in the post. Test program: .NET 4.5 console app in Release mode run without debugger attached. Hardware: i7-4700HQ 2.4-3.4GHz 4 Core CPU, 8GB DDR3/1600MHz RAM. System: Windows 7 Home Premium x64.
