I have been using Codealike for a while now and thought I'd share my experience and things that I like about codealike with everyone. I did mention codealike on This Week on Ch9 when I hosted it last week with Greg Duncan.
What is codealike?
Codealike is a service that tracks your activity while you code normally. Once you've installed and signed in to your preferred IDE, the plug in will track, process and send the data to our servers so you can visualize it anytime you want to learn how you work and how to improve through trustworthy data.
How Do I Get Started?
First off, head to https://codealike.com/ and create an account. Then, you need to install the Visual Studio plug in from the Visual Studio Extension Gallery https://visualstudiogallery.msdn.microsoft.com/4cd5e9ff-d183-46e0-9934-c8832924abb7. After you have installed it and signed into codealike from within Visual Studio, you can code for a bit and you can go back to https://codealike.com/ and sign in to see your metrics.
What Can You See in the codealike Metrics?
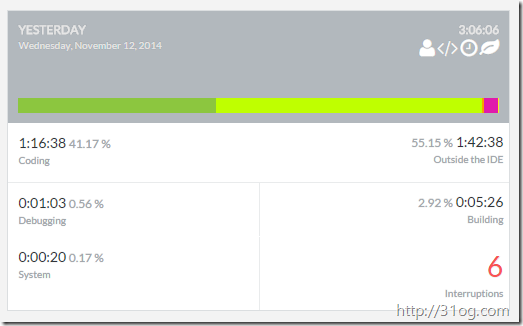
You can see a bunch of metrics in codealike like a summary for the previous day's coding, this weeks coding, this month and last month's coding which looks something like below:

Another useful thing is the calendar view that shows you each day that codealike has metrics for you:

On this calendar view, you can see days that you were "On Fire" which is basically days where you have coded above average (compared to other users). You can click on certain days to see reports on that days' work which is quite useful.

And then you can see things like which solutions you opened most, files you debugged the most, solutions you debugged the most, etc. Another nice view/chart/report that is shown on this page is the overall day summary which looks something like below:

Another Good Use Case
So besides just using this to know what's going on with your daily coding, if you were a contractor that works on lots of projects at once, you could use the Code Tree Report filtered to a custom date range or a bunch of predefined periods like this month, last month, etc. and see how many hours you spent working on certain solutions which would look something like this:

Features
There are a bunch of features that are described in the services section of the site. Something that can be quite useful is the Team Members Reports* where you can see in one report an overview of yours and your teams' work for projects that you are working on in one view instead of having to jump around between accounts. Also, if you want to do some more in depth analysis of your data, you are able to download* it out of codealike and then maybe use something like Power View in Excel to look at it in different ways.
* Premium Feature
Behavior Features
There is also a Behaviors section which shows you where you are most productive with things like productivity pattern per machine.

Sharing Your Metrics
You are able to share your metrics using the facts feature which would look something like below:

You basically navigate to the facts section of your account and you'll be given an HTML snippet like:
<iframe src='https://codealike.com/Profile/FactsWidget/Gordon-Beeming'
frameborder='0' scrolling='no' marginheight='0'
marginwidth='0' width='600px' height='370px'></iframe>
and then, you will see your live details loaded as seen at the bottom of my blog.
Why Should You Use It?
As you can see from above, there is a bunch of useful information that you can get out of codealike. If you have navigated to the codealike features page, you would see that some of the cool features are premium features which you would normally need to pay about $12 a month or $100 a year. But if you email me, I have a limited number of tokens that I am able to give out for Premium access to codealike, so what you waiting for? Send an email to me at codealike@beeming.co.za with preferably a link to who you are (blog, twitter, other social media, etc.) and if I have tokens left, I'll forward them on to you =D.
