Introduction
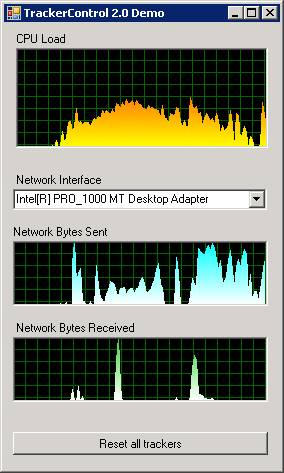
A while ago, I stumbled over an article written by Andelko Pavelic. I looked into the code and found it to be an interesting approach. But I needed something more stable, accurate and flexible - and I needed better looks. So I took the base idea and wrote my own version, the TrackerControl 2.0. Although almost nothing is left of Andelko's initial code, credits belong to him for providing the initial idea.
Using the Code
There is a bunch of additional features and properties added to the original control.
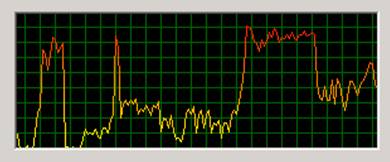
First of all, the coloring of the drawn graph is extended to optionally use a linear color gradient:
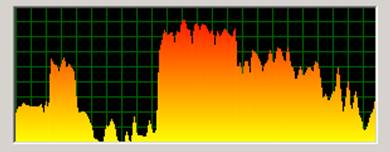
To make it more plastic, the area underneath the graph can be colorized:
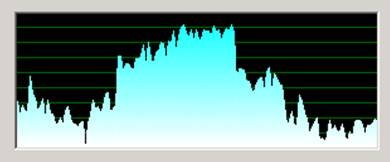
The grid can be adjusted in mesh size and optionally horizontal and/or vertical grid lines can be blanked:
The wider the control, the more values are represented by the graph. I found it helpful in some cases to visualize the average as a horizontal bar:
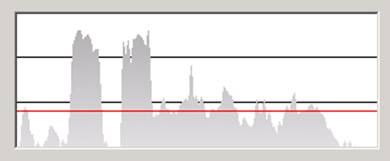
The average bar's color can also be set to a linear gradient, other than the one of the graph.
There are some features that can hardly be shown with still pictures, such as:
GridMovement.MoveWithGraph and GridMovement.Fixed
The grid can progressively move with the graph or stay fixed in the background.
GraphSizeMode.Fixed
GraphSizeMode.Zoom
GraphSizeMode.AutoAdjustMaximum
GraphSizeMode.Zoom, the graph's color gradient is fully utilized. The Maximum value in AutoAdjustMaximum acts as the initial internal maximum and also as the internal lower bound for its auto adjustment.
TrackerRefreshInDesignMode, TrackerRefreshInRuntimeMode and TrackerRefreshStartOnFirstValue
TrackerControl during runtime. The third prevents the Control from refreshing until it gets the first value to be drawn.
StartValue
ResetValueBuffer
Points of Interest
Combining the settings help to customize visualization. They can also be changed during runtime, allowing interesting visual effects.
Keep in mind that there is no error handling implemented. Eventually, you need to do this yourself according to your application's exception handling strategy.
History
- 6th June, 2010: Initial post
