At the company I work for, we had a situation where a highly loaded server that was handling several thousands requests per second consumed memory increasingly, and after about 30 days, it would become unusable and required a restart. By looking at our monitoring tools, we concluded it was clearly a memory leak, and we figured it must be an easy one to detect as memory exhibited an almost perfect linear grow. The first thing we did was we took a heap dump and looked at most frequent instances and to our shock over 30 GB of memory was occupied by log4j loggers!
Hunting the Memory Leak
We started to try to isolate the problem and found a possible red flag - for every client that connected, we generated a new logger containing class name and IP address of the client. It was very easy to set up an experiment to test the hypothesis. I created a minimal piece of code that created a lot of dynamically named loggers and attached a profiler to it. For this simple case, Java VisualVM, which comes with Java is more than enough.
for( int i = 0; i < 100000; i++) {
    Logger.getLogger("Logger - " + i);
}
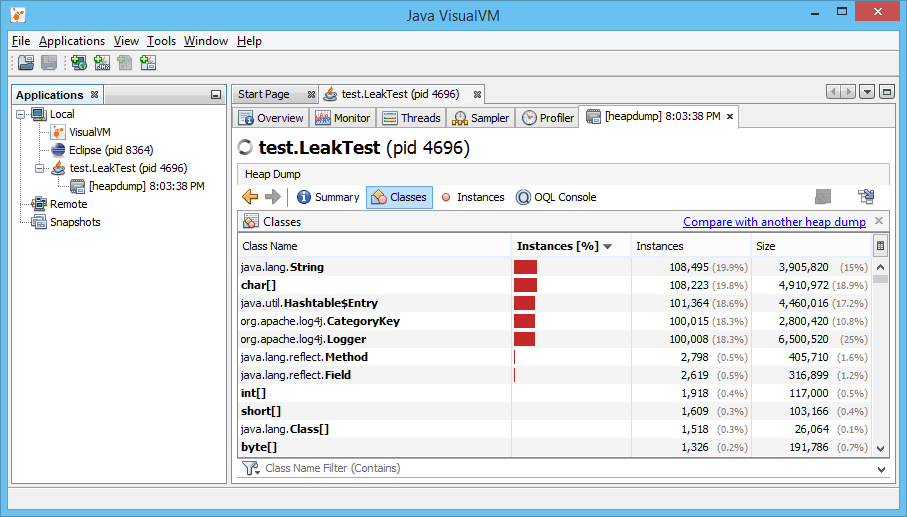
jvisualvm can be found in the bin folder of your jdk. I run the test code from IDE and made it stop after creating the loggers. After that, I opened jvisualvm, found my process at Application list and took a heap dump (can be done by right clicking on process and selecting Heap Dump). After the dump is generated, I opened ‘Classes’ tab. Here is how it looks like:

We can see that there is more than 100,000 instances of log4j classes, each holding strings that can really add up to size and eat heap memory. The solution was very simple, we just replaced creating a new logger with a static one. This doesn’t mean you should be conservative and use one logger per application - it is still a good idea to create loggers named by logical parts of your application of even named by class names as soon as you don’t create new loggers uncontrollably. Share your favourite tools and methods for hunting memory leaks in comments and subscribe for more interesting debugging adventures!
CodeProject
