Introduction
This article describes a quick and easy example of communicating with Excel from .NET.
Using the code
I have included the complete source code in the attached example project. The sample illustrates how to:
- Add reference to the Excel application
- Add Excel Workbook/Sheets
- Insert data to an Excel Worksheet
- Add a Pivot Table to an Excel Worksheet
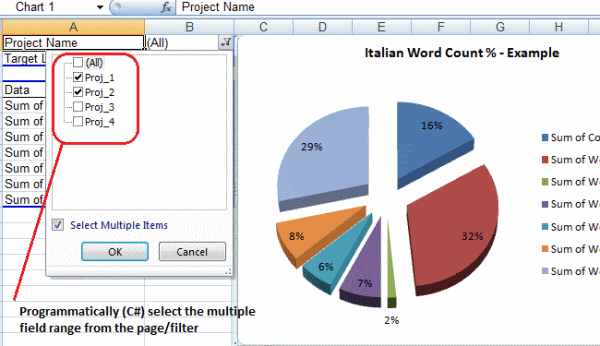
- Add a filter to the Pivot Table where multiple items can be selected
- Add a graphic chart to display the data from the Pivot Table
This code example is aimed at programmer having difficulty with C#/ Excel interop (especially related to the multiple item filter from the Pivot Table).
Examples
Adding a pivot table to an Excel Worksheet:
Excel.PivotCaches pch = m_objBook.PivotCaches();
_m_objSheet_Data.Activate();
pch.Add(Excel.XlPivotTableSourceType.xlDatabase, "'"
+ _m_objSheet_Data.Name + "'!A1:'" + _m_objSheet_Data.Name
+ "'!J5").CreatePivotTable(_m_objSheet_Report_1.Cells[1, 1],
"PivTbl_1", Type.Missing, Type.Missing);
Excel.PivotTable pvt = _m_objSheet_Report_1.PivotTables("PivTbl_1")
as Excel.PivotTable;
Excel.PivotField fld = ((Excel.PivotField)pvt.PivotFields("Context Matches"));
fld.Orientation = Excel.XlPivotFieldOrientation.xlDataField;
fld.Function = Microsoft.Office.Interop.Excel.XlConsolidationFunction.xlSum;
fld.NumberFormat = "#,##0_);[Red](#,##0)";
fld = ((Excel.PivotField)pvt.PivotFields("Words (100)"));
fld.Orientation = Excel.XlPivotFieldOrientation.xlDataField;
fld.Function = Microsoft.Office.Interop.Excel.XlConsolidationFunction.xlSum;
fld.NumberFormat = "#,##0_);[Red](#,##0)";
pvt.DataPivotField.Orientation = Excel.XlPivotFieldOrientation.xlRowField;
Enabling the multiple items filter on the Pivot Table:
fld_projectName.CurrentPage = "(All)";
Excel.PivotFields _PivotFields =
(Excel.PivotFields)pvt.get_PageFields(Missing.Value);
foreach (Excel.PivotField _PivotField in _PivotFields)
{
if (string.Compare(_PivotField.Caption, fld_projectName.Caption, true) == 0)
{
Excel.PivotItems _PivotItems =
(Excel.PivotItems)_PivotField.PivotItems(Missing.Value);
foreach (Excel.PivotItem _PivotItem in _PivotItems)
{
if (ListToFilter.Contains(_PivotItem.Caption))
_PivotItem.Visible = true;
else
_PivotItem.Visible = false;
}
}
}
pvt.DataPivotField.Orientation = Excel.XlPivotFieldOrientation.xlRowField;
Adding a chart object:
Excel.ChartObjects _ChartObjects = (Excel.ChartObjects)
(_m_objSheet_Report_1.ChartObjects(Missing.Value));
Excel.ChartObject _ChartObject = _ChartObjects.Add(170, 0, 400, 300);
Excel.Chart _Chart = _ChartObject.Chart;
_Chart.SetSourceData(_m_objRange_Chart, Excel.XlRowCol.xlColumns);
_Chart.ChartType = Microsoft.Office.Interop.Excel.XlChartType.xl3DPieExploded;
_Chart.HasTitle = true;
_Chart.ChartTitle.Text = "Italian Word Count % - Example";
_Chart.ChartTitle.Font.Size = 12;
_Chart.ApplyDataLabels(
Microsoft.Office.Interop.Excel.XlDataLabelsType.xlDataLabelsShowNone
, Missing.Value, Missing.Value, Missing.Value, Missing.Value, false
, Missing.Value, true, Missing.Value, Missing.Value);
_Chart.Rotation = 0;
_Chart.Elevation = 60;
_Chart.Perspective = 10;
_Chart.DepthPercent = 100;
_ChartObject.Chart.HasLegend = true;
