Introduction
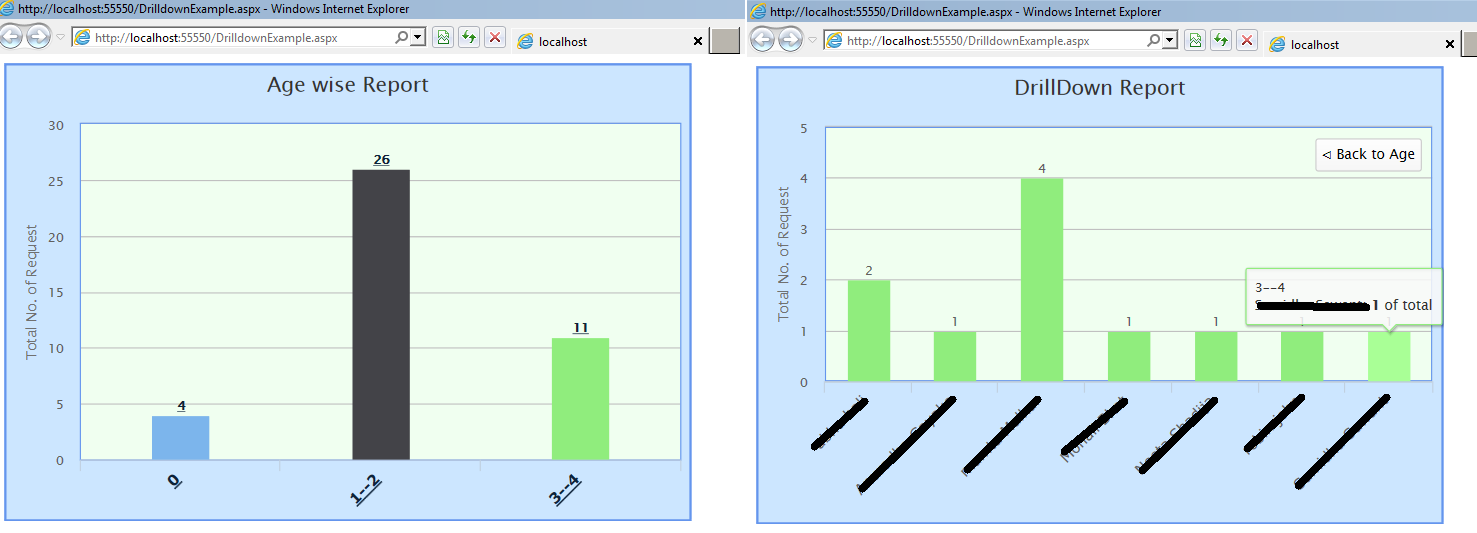
This tip will help developers to generate drilldown charts using HighChart (Jquery) and ASP.NET and SQL.
Background
Due to difficulty in showing large data in one chart, I have decided to divide this chart into sub-groups. (Here, I have divided chart into Age and Person groups.)
Using the Code
I have divided code into three parts:
- SQL queries to pull data
- WebService
- WebPage
SQL DATA
Age    AgeCount (Table1)
0          12
1--2       25
Name        Age    AgeCount  (Table2)
A           1--2       2
B           1--2       1
C           1--2       7
create table table1
(
Age varchar(10),
AgeCount INT
)

GO

create table table2
(
Name varchar(10),
Age varchar(10),
AgeCount INT
)

GO

Create Procedure usp_ManagerMetrix_AgeDashboardTotal
@intSystemId INT,
@intLoggedinUserId INT
as
Begin
  -- depend on some conditions I am going to calculate Age and AgeCount values
  -- for this purpose Paramaters are defined
  select Age,AgeCount from Table1

End


Create Procedure usp_ManagerMetrix_AgeDashboardDetail
@intSystemId INT,
@intLoggedinUserId INT,
@AgeType varchar(10)
as
Begin
  -- depend on selected age conditions I am going to dispaly drilldown chart
  select Age,Name,AgeCount from Table2
  where Age=@AgeType

End
JavaScript Code
<script src="Script/jquery.min.js" type="text/javascript"></script>
<script src="Script/highcharts.js" type="text/javascript"></script>
<script src="Script/drilldown.js" type="text/javascript"></script>
<script type="text/javascript">
$(document).ready(function () {
$.ajax({
type: "POST",
contentType: "application/json; charset=utf-8",
url: "Services/WebServiceChart.asmx/GetTotal",
data: JSON.stringify({ intSystemId: 1, intLoggedinUserId: 1 }),
dataType: "json",
success: function (Result) {
Result = Result.d;
var data = [];
for (var i in Result) {
var serie = { name: Result[i].Age,
y: Result[i].AgeCount, drilldown: Result[i].drilldown };
data.push(serie);
}
BindChart(data);
},
error: function (Result) {
alert(Result.toString());
}
});
});
function BindChart(seriesArr) {
$('#container').highcharts({
chart: {
type: 'column',
backgroundColor: '#CCE6FF',
borderColor: '#6495ED',
borderWidth: 2,
className: 'dark-container',
plotBackgroundColor: '#F0FFF0',
plotBorderColor: '#6495ED',
plotBorderWidth: 1,
events: {
drilldown: function (e) {
if (!e.seriesOptions) {
var chart = this;
chart.showLoading('Loading Data ...');
var dataArr = CallChild(e.point.name);
chart.setTitle({
text: 'DrillDown Report'
});
data = {
name: e.point.name,
data: dataArr
}
setTimeout(function () {
chart.hideLoading();
chart.addSeriesAsDrilldown(e.point, data);
}, 1000);
}
}
}
},
title: {
text: 'Age wise Report'
},
xAxis: {
type: 'category',
labels: {
rotation: -45,
style: {
fontSize: '13px',
fontFamily: 'Verdana, sans-serif'
}
}
},
yAxis: {
title: {
text: 'Total No. of Request'
}
},
tooltip: {
headerFormat: '<span style="font-size:11px"
>{series.name}</span><br>',
pointFormat: '<span style="color:{point.color}"
>{point.name}</span>: <b>{point.y}</b> of total<br/>'
},
legend: {
enabled: false
},
plotOptions: {
series: {
borderWidth: 0,
dataLabels: {
enabled: true
}
}
},
series: [{
name: 'Age',
colorByPoint: true,
pointWidth: 50,
data: seriesArr
}],
drilldown: {
series: [{
pointWidth: 50
}]
}
});
}
function CallChild(name) {
var Drilldowndata = [];
$.ajax({
type: "POST",
contentType: "application/json; charset=utf-8",
url: "Services/WebServiceChart.asmx/GetTotalDetail",
data: JSON.stringify({ intSystemId: 1,
intLoggedinUserId: 1, AgeType: name }),
dataType: "json",
success: function (Result) {
Result = Result.d;
for (var i in Result) {
var serie = { name: Result[i].Name, y: Result[i].AgeCount };
Drilldowndata.push(serie);
}
},
error: function (Result) {
alert("Error");
}
})
return Drilldowndata;
}
</script>
On WebPage, add this div:
<div id="container" style="width 100px; height: 400px;">
   </div>
WebService Code
using System.Web.Services;
using Microsoft.Practices.EnterpriseLibrary.Data;
[WebService(Namespace = "http://tempuri.org/")]
[WebServiceBinding(ConformsTo = WsiProfiles.BasicProfile1_1)]
[System.ComponentModel.ToolboxItem(false)]
[System.Web.Script.Services.ScriptService]
public class WebServiceChart : System.Web.Services.WebService
{
public class AgeEntity
{
public string Age { get; set; }
public int AgeCount { get; set; }
public string drilldown { get; set; }
}
public class AgeNameEntity
{
public string Age { get; set; }
public string Name { get; set; }
public int AgeCount { get; set; }
}
[WebMethod]
public List<AgeEntity> GetTotal(int intSystemId, int intLoggedinUserId)
{
List<AgeEntity> Total = new List<AgeEntity>();
DataSet ds=new DataSet() ;
try
{
string constr = "Data Source=SERVER;Initial Catalog=DB;
User ID=ID;password=PWD;Connect Timeout=1000;";
using (SqlConnection con = new SqlConnection(constr))
{
using (SqlCommand cmd = new SqlCommand())
{
SqlParameter SystemId =
new SqlParameter("@intSystemId",SqlDbType.Int,int.MaxValue);
SystemId.Value = 1;
SqlParameter LoggedinUserId =
new SqlParameter("@intLoggedinUserId", SqlDbType.Int, int.MaxValue);
LoggedinUserId.Value = 1;
cmd.Parameters.Add(SystemId);
cmd.Parameters.Add(LoggedinUserId);
cmd.Connection = con;
cmd.CommandType = CommandType.StoredProcedure;
cmd.CommandText = "usp_ManagerMetrix_AgeDashboardTotal";
con.Open();
using (SqlDataAdapter da = new SqlDataAdapter(cmd))
{
da.Fill(ds, "dsTotal");
}
}
}
if (ds != null)
{
if (ds.Tables.Count > 0)
{
if (ds.Tables["dsTotal"].Rows.Count > 0)
{
foreach (DataRow dr in ds.Tables["dsTotal"].Rows)
{
Total.Add(new AgeEntity
{
Age = dr["Age"].ToString(),
AgeCount = Convert.ToInt32(dr["AgeCount"]),
drilldown = "Age" + dr["Age"].ToString()
});
}
}
}
}
}
catch (Exception ex)
{
}
return Total;
}
[WebMethod]
public List<AgeNameEntity> GetTotalDetail(int intSystemId, int intLoggedinUserId, string AgeType)
{
List<AgeNameEntity> TotalDetail = new List<AgeNameEntity>();
DataSet ds = new DataSet();
using (SqlConnection con = new SqlConnection
(" Data Source=SERVER;Initial Catalog=DB;User ID=ID;password=PWD;")
{
using (SqlCommand cmd = new SqlCommand())
{
cmd.CommandText = "usp_ManagerMetrix_AgeDashboardDetail";
cmd.CommandType = CommandType.StoredProcedure;
cmd.Parameters.AddWithValue("@intSystemId", 1);
cmd.Parameters.AddWithValue("@intLoggedinUserId", 1);
cmd.Parameters.AddWithValue("@AgeType", AgeType);
cmd.Connection = con;
using (SqlDataAdapter da = new SqlDataAdapter(cmd))
{
da.Fill(ds, "dsDetail");
}
}
}
if (ds != null)
{
if (ds.Tables.Count > 0)
{
if (ds.Tables["dsDetail"].Rows.Count > 0)
{
foreach (DataRow dr in ds.Tables["dsDetail"].Rows)
{
TotalDetail.Add(new AgeNameEntity
{
Age ="Age"+ dr["Age"].ToString(),
Name = dr["Name"].ToString(),
AgeCount = Convert.ToInt32(dr["AgeCount"])
});
}
}
}
}
return TotalDetail;
}
}
Points of Interest
HighChart implementatation using ASP.NET
