Introduction
Once upon a time, in a far and cold country, a group of brave engineers fought with Memory Consumption. Memory Consumption was the beast that no one could conquer…
Okay, the story was windy, and to make it shorter, let's get right to the Happy End chapter.
Happy End Chapter
The very essence of programming is to take an input and turn it into an output, right?
In our case, the input is malloc/free calls. And output is a cross-platform view.
You know that there is a way to hook CRT malloc/free functions on OSX, Linux and Windows? They are quite different, but all of them take just a few lines of code.
The bigger question is how to make a nice output with just a few lines of code?
Let's dream a little... what if there was a single cross-platform API that allows to generate different tracing formats understood by various OS dependent and independent viewers? That would be perfect!
Close your eyes, count to three... and voila! https://github.com/01org/IntelSEAPI
Clone/download the source and let's begin!
Hooking CRT
1. OSX
The best allocation hooking mechanism for my taste is at MAC OS X, all you need to keep in mind is the name of malloc_default_zone function and the fact that the structure it returns is in protected page.
malloc_zone_t* pMallocZone = malloc_default_zone();
if (!pMallocZone) return false;

vm_protect(mach_task_self(), (uintptr_t)pMallocZone, sizeof(malloc_zone_t), _
		0, VM_PROT_READ|VM_PROT_WRITE);

g_origMalloc = pMallocZone->malloc;
pMallocZone->malloc = MallocHook;

g_origFree = pMallocZone->free;
pMallocZone->free = FreeHook;

g_origFreeDefSize = pMallocZone->free_definite_size;
pMallocZone->free_definite_size = FreeDefSizeHook;

vm_protect(mach_task_self(), (uintptr_t)pMallocZone, sizeof(malloc_zone_t), 0, VM_PROT_READ);
You can find the complete code in the memory.cpp file.
The main problem comes when you realize that to debug memory, you need to allocate one... But the solution is simple: we need to detect recursive call. There is nothing better than Thread Local Storage for such case.
Old good "static __thread bool" could do the trick, but OSX implementation of "__thread" uses malloc inside. Bad luck.
Let's call to ancient magic: pthread_key_create, pthread_setspecific, pthread_getspecific - these guys work directly with the thread record and do not allocate anything.
void* MallocHook(struct _malloc_zone_t *zone, size_t size)
{
    if (pthread_getspecific(tls_key))
        return g_origMalloc(zone, size);
2. Linux
Linux has two ways to hook allocations - the outdated:
based on explicit use of __malloc_initialize_hook, __malloc_hook, __free_hook variables - now it's marked as deprecated in malloc.h.
And alternative
based on symbol resolution order - if you just define malloc and free functions in you compilation unit, they will be used.
In Both OSX and Linux cases, we call the original malloc/free from inside our hook and put __itt mark up around original calls to create the output.
3. Windows
From one hand, the Windows mechanism is simple, just register your callback with _CrtSetAllocHook and receive notifications: _HOOK_ALLOC, _HOOK_FREE.
int(int allocType, void *userData, size_t size, int blockType,
long requestNumber, const unsigned char *filename, int lineNumber);
But it's subtle. The problem is that call-back is called only before malloc and before free, not after.
So we have memory pointer in 'free' hook, but not in 'malloc'. And how to identify pairs of malloc/hook after that?
Well, here we need not only a hook but also a hack.
Let's look closer at what we get on _HOOK_ALLOC - there is a requestNumber. Can we match it with the requestNumber in _HOOK_FREE?
No! Because on _HOOK_FREE, the 0 is always passed to requestNumber what a shame!
And yes! Because userData is pointing to memory after CRT block that has the requestNumber.
Here is what we do: (((_CrtMemBlockHeader*)userData)-1)->lRequest
Since in visual representation the real value of pointer is not important, we can use the requestNumber as id to match the malloc/free pair.
Visualization
That's an easy part.
We add:
__itt_heap_allocate_begin/__itt_heap_allocate_end around the original call to malloc inside our hooks.
and __itt_heap_free_begin/__itt_heap_free_end around the original call to free.
void* MallocHook(size_t size, const void * context)
{
    if (pthread_getspecific(tls_key))
        return g_origMalloc(size, context);
    CRecursionScope scope;

    __itt_heap_allocate_begin(g_heap, size, 0);
    void* res = g_origMalloc(size, context);
    __itt_heap_allocate_end(g_heap, &res, size, 0);

    return res;
}

void FreeHook(void* ptr, const void* context)
{
    if (pthread_getspecific(tls_key))
        return g_origFree(ptr, context);
    CRecursionScope scope;

    __itt_heap_free_begin(g_heap, ptr);
    g_origFree(ptr, context);
    __itt_heap_free_end(g_heap, ptr);
}
And then, we run our project following the prescription on the page.
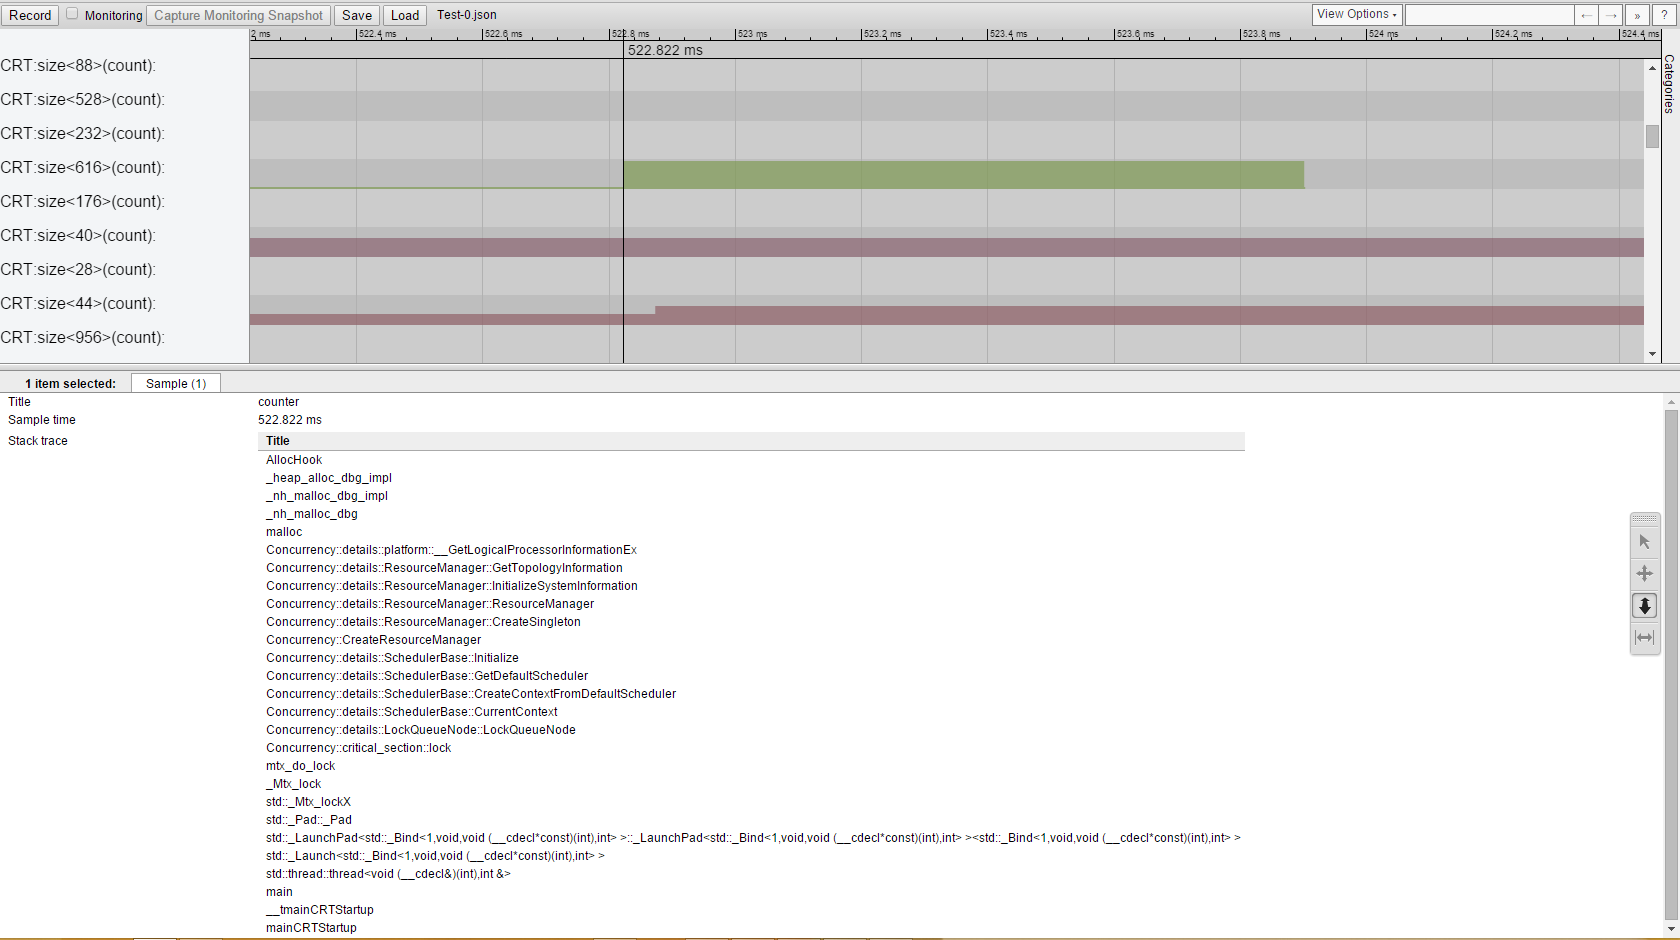
With chrome://tracing viewer, we get this nice picture:

For each memory block size, you can see the history of count changes. And you can easily find where the memory goes.
If by the end of the trace, a block doesn't have zero count, it leaked.
History
I will appreciate any ideas on improvements of the approach. And with your help, we will create something magnificent.
Update 1
Now the allocations of Intel(R) Single Event API itself are filtered out.
Update 2
Now you can see stacks of allocations.
Update 3
Memory operations are now attributed to functions:

Which reads: second call to CreateThread has freed a 8 bytes block once, allocated a 16 bytes blocks twice and plus one block of 1144 bytes, which gave total of +1168 bytes during this function call.
Update 4
Visual Studio 2015 support.
