Introduction
This tip for those developers who are using angularjs as front-end and want to use some good JavaScript Chart library. As per my suggestion, chartjs is JavaScript base charting library having great support. In this tip, we will be using the following things:
- AngularJs (version 1.n)
- tc-angular-chartjs download From GitHub (enables us to use chart.js)
- ChartJS download From GitHub
So finally, you will get the complete handling of super fantastic chart library chart.js using tc-angular-chartjs (from GitHub) module........ :) without writing plain JavaScript code in the Angular JS application.
Background
I was developing an application which was using the angular(v1n) and bootstrap on frontend and restful webAPI on backend. Application contained many charts to display data. So I was looking for the library that had a lot more charting options. Finally, I got chart.js as the one.
Problem
To use the chartJS with Angular directly, we need to write plain JavaScript code which again is not a good practice. So to use it in the Angular way, we use the tc-angular-chartjs module.
"As per Angular documentation, using of plain JavaScript or jquery is not a good practice."
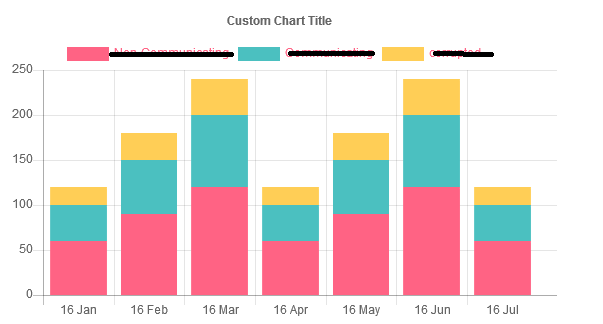
Target (Create a Stack Bar Chart Using chartJS)

Steps to Follow
- Download ChartsJs and tc-angular-chart.js from GitHub and add ChartsJs and tc-angular-chart.js to your project. We will add all the chart js in the Chart_Module folder as shown in the image below:
- https://github.com/chartjs/Chart.js
- https://github.com/carlcraig/tc-angular-chartjs
- Also add angular-chart.js from https://jtblin.github.io/angular-chart.js/

- Add the reference after angular.js (1.n)
<script src="scripts/Chart_Module/Chart.js"></script>
<script src="scripts/Chart_Module/angular-chart.min.js"></script>
<script src="scripts/Chart_Module/tc-angular-chartjs.min.js"></script>
Example: I am adding reference in my Index.html page. Add reference order is important.
- Add the chart HTML given below to any page:
<div ng-controller="testCtrl">
      <canvas tc-chartjs-bar chart-data="data"
              chart-options="options" width="350"
              height="200">
      </canvas>
  </div>
- Add the following code to the controller:
app
.controller('testCtrl', function ($scope) {
$scope.data = {
labels: ['16 Jan', '16 Feb', '16 Mar',
'16 Apr', '16 May', '16 Jun', '16 Jul'],
datasets: [
{
label: "A",
backgroundColor: 'rgba(255, 99, 132, 1)',
borderColor: 'rgba(255,99,132,1)',
data: [60, 90, 120, 60, 90, 120, 60]
},
{
label: "B",
backgroundColor: 'rgba(75, 192, 192, 1)',
borderColor: 'rgba(75, 192, 192, 1)',
data: [40, 60, 80, 40, 60, 80, 40]
},
{
label: "C",
backgroundColor: 'rgba(255, 206, 86, 1)',
borderColor: 'rgba(255, 206, 86, 1)',
data: [20, 30, 40, 20, 30, 40, 20]
}
]
};
$scope.options = {
scales: {
xAxes: [{
stacked: true
}],
yAxes: [{
stacked: true
}]
},
legend: {
display: true,
labels: {
fontColor: 'rgb(255, 99, 132)'
}
},
title: {
display: true,
text: 'Custom Chart Title'
}
};
});
Points of Interest
So what have we achieved:
Now, we can use any property of the chart.js charts in your AngularJS code style.
Please see the following document for chart customization.
History
- 17th November, 2016: Initial version
