In this tip, you will see how to design reports for on-premise Dynamics AX 2012 R3 (Dynamics 365 Finance and Operations) hosted instances utilizing Tableau Desktop and also with other sources of input.
Introduction
Designing the reports for on-premise Dynamics AX 2012 R3 (Dynamics 365 Finance and Operations) hosted instances utilizing Tableau Desktop and also with other sources of input. However there are different products that Tableau offers, but this article focuses on few Tableau Desktop application capabilities.
The version that was used for demonstration here is Tableau 10.1.
The article mainly focuses on the below points utilizing the Tableau Desktop client :
- Using SQL Server Connection with the TABLEAU DESKTOP
- Creating Datasources Using ODATA Service
- TABLEAU WITH SSAS CUBES
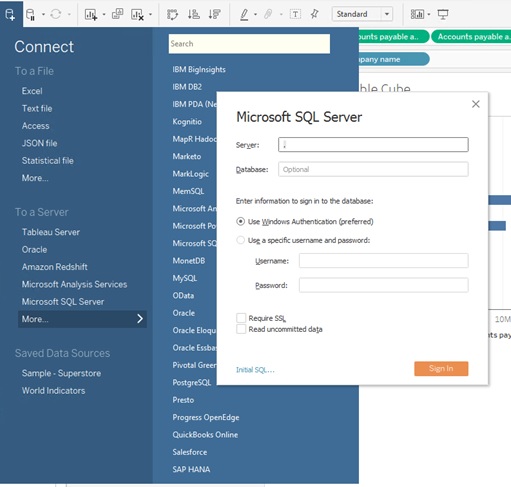
1. Using SQL Server Connection with the TABLEAU DESKTOP
Creating datasources using SQL Server, provide the authentication details:

Copy the SQL query in the Preview the results in the Custom SQL Query design.
Sample query used for Item Summary demonstration purpose only:
SELECT UPPER(IT.DataAreaId) AS COMPANY,IT.ItemId,ISNULL((SELECT SUM(SL.QtyOrdered) _
FROM SalesLine SL WHERE SL.ItemId = IT.ItemId _
AND SL.DataAreaID = IT.DataAreaID AND SL.Partition  = IT.Partition), 0)   _
AS QtySold, ISNULL((SELECT SUM(SL.LineAmount) FROM SalesLine SL _
WHERE SL.ItemId = IT.ItemId   AND SL.DataAreaID = IT.DataAreaID  _
AND SL.Partition  = IT.Partition), 0)  AS Sales,  ISNULL((SELECT SUM(PL.QtyOrdered) _
FROM PurchLine PL   WHERE PL.ItemId  = IT.ItemId  AND PL.DataAreaID = IT.DataAreaID _
AND PL.Partition  = IT.Partition), 0)  AS QtyBought, ISNULL((SELECT SUM(PL.LineAmount)  _
FROM PurchLine PL  WHERE PL.ItemId     = IT.ItemId  AND PL.DataAreaID = IT.DataAreaID _
AND PL.Partition  = IT.Partition), 0)   AS Purchased  FROM InventTable IT _
WHERE  IT.Partition = 5637144576 Group By IT.DataAreaId, IT.Partition, IT.ItemId

Once the Query is added, you can drag the dimension, measures, SUM fields onto the layout to slice and dice the data columns and rows the way you want.

2. Creating Datasources using ODATA Service
Validate OData service is accessible in IE browser before consuming it. (Please prefer using full naming convention instead of localhost.)
/$metadata - will list out all the Entities that are available in the system as demonstrated in the image below:

Consuming the OData service entities from the available datasources.
Once the specified entity is set, the user can then drag the dimensions and measures from the available list onto the page layout.

3. TABLEAU WITH Dynamics AX - SSAS CUBES
BELOW REPORT WAS DESIGNED USING SSAS OUT OF THE BOX CUBES.
Provide the Server Connection details of Microsoft Analysis Services, it should present you with the following screen displaying available list of cubes.

Once the specified cube is set, the user can then drag the dimensions and measures from the list onto the design page layout to slice and dice the data according to the requirement.

After designing these pages, you can upload and publish/deploy them to the Tableau Cloud Server and share the content to the users, so they can access through the dashboards. Tableau is now one of the Salesforce product which was recently acquired in 2019. There are lots of customers/clients still using this tool.
Basically, this is to give a quick tour through the Tableau options available in the desktop version which were captured at a point in time, since it was designed some time ago. I had faced some challenges initially and looked for some online help while learning & preparing this demonstration.
Below is the link to the discussion with Dynamics user community:
History
- 5th March, 2021: Initial version
