Introduction
This is a simple program I developed recently as I was looking for a way to quickly plot some data points by just piping the data from a CSV file into a plotting utility using the DOS command line and type command:
C:\MyData>type SampleData.csv | QuickPlot.exe
With bash, you could use the cat command:
$ cat SampleData.csv | QuickPlot.exe
For those who are not familiar with the pipe character ('|') in shell command lines, it is used to send the standard output from the left hand command directly to the standard input of the command on the right hand side of the pipe. Thus, the output of the type (or cat) command, that is, the contents of the data file, goes directly into the standard input of the QuickPlot program.
(In both cases, we are assuming that the SampleData.csv file is in the same directory as the executable. Otherwise, you must specify the paths explicitly.)
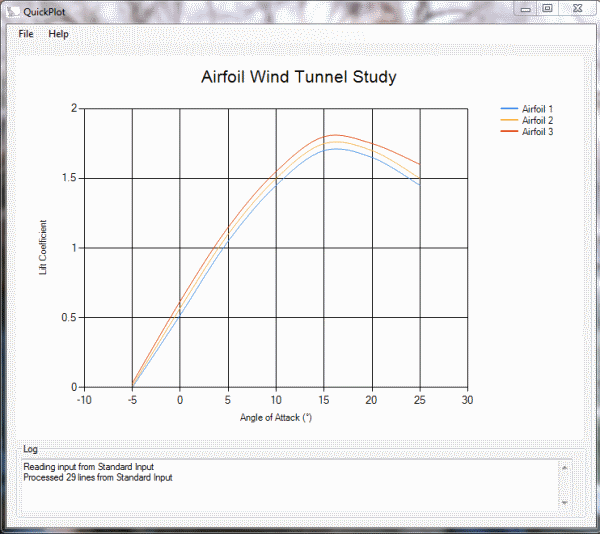
There is also the usual File->Open command on the menu to read and plot a data file. The file SampleData.csv shows the data format. Essentially, you can have one or more named series of data that are plotted as X-Y pairs. For example, here is a series named "Airfoil 1", and the X-Y data pairs follow, separated by commas:
Series,Name:Airfoil 1,ChartType:Spline
-5.0,0.0
+0.0,0.52
+5.0,1.05
+10.0,1.45
+15.0,1.70
ChartType can be "Spline" or "Point" to draw a line, or just the data points, respectively. The file SampleData.csv contains three such series.
The labels for the X and Y axes, title of the plot, and title font can be specified as in the following example:
Chart,AxisX:Angle of Attack (°),AxisY:Lift Coefficient,
Title:Airfoil Wind Tunnel Study,FontFamily:Helvetica,FontEmSize:16.0
Using the Code
Download and open the QuickPlot project with Visual Studio. Build it by pressing F6. The code to parse the CSV file is encapsulated in a class called ParseCSVFile. The idea here is that if you have a data file with a different format, this should be the only class that needs to be modified.
When using the pipe operator as described above, that is, when no file name is specified, the data stream constructor to read from standard input is:
streamReader = new StreamReader(Console.OpenStandardInput(), encoding);
Otherwise, if a file is specified via the File->Open command on the menu, it is supplied to the StreamReader constructor using the full path to the file as specified in the fullPath variable:
streamReader = new StreamReader(fullPath, encoding);
This project uses the powerful System.Windows.Forms.DataVisualization.Charting.Chart namespace. The field chart1 is the actual chart in the QuickPlotForm and performs all of the "heavy lifting" of plotting the data. You can set the axis titles, the chart title, the data series, and so on, directly via the chart1 field. For example, to set the title of the chart, you can simply set chart1.Titles["Title1"].Text = "My Title"
I added a System.Windows.Forms.DataGridView in order to display the data in tabular form. This is the field dataGridView1 in the QuickPlotForm. To specify the data source, you can use the ComboBox labelled "Series" to set the dataGridView1.DataSource to the desired table created by the GridDataTable.GetTables() method. Each table corresponds to a series in the input file. You can use the File->Show Grid to display the data on the right-hand side of the form; File->Hide Grid will hide the grid.

I used Jeff Atwood and Scott Ferguson's Generic About Box dialog under Help->About.
History
- April 04, 2018: Version 1.0
