Introduction
In this article, I would like to show you how to create a line and point chart for your ASP.NET application.
Background
I assume you have a basic knowledge of ASP.NET and C#.NET, and so on.
NPlot is an open source charting library for the .NET Framework. Its interface is both simple to use and flexible. The ability to quickly create charts makes NPlot an ideal tool for
inspecting data in your software for debugging or analysis purposes. On the other hand, the library's flexibility makes it a great choice for creating carefully tuned charts for publications
or as part of the interface to your Windows.Forms or Web application.
To prepare for a chart, use these steps given below.
How to configure
Step 1
Download from http://sourceforge.net/projects/nplot/files/nplot/0.9.10.0/.
Step 2:
Start a new web-site; give the name as nplotGraph. It will give you one Default.aspx and
.cs file.
Step 3:
Download source code and copy the nplot.dll file from the bin directory to some location. Now add a reference to this
nplot.dll file.
Step 4
If you would like to use NPlot with the Windows.Forms designer within Visual Studio, you should add the
NPlot.Windows.PlotSurface2D control to the Toolbox. To do this, right click
the toolbox panel and select "Choose Items”. After the “Choose Toolbox items” dialog box appears, select the "Browse" button and navigate to the
NPlot.dll location, and double click to
add the NPlot controls to the list available for selection (see figure 1). Make sure the
NPlot.Windows.PlotSurface2D control is checked and press OK. You can now use the
PlotSurface2D in the designer as you would any other control.
Using the code
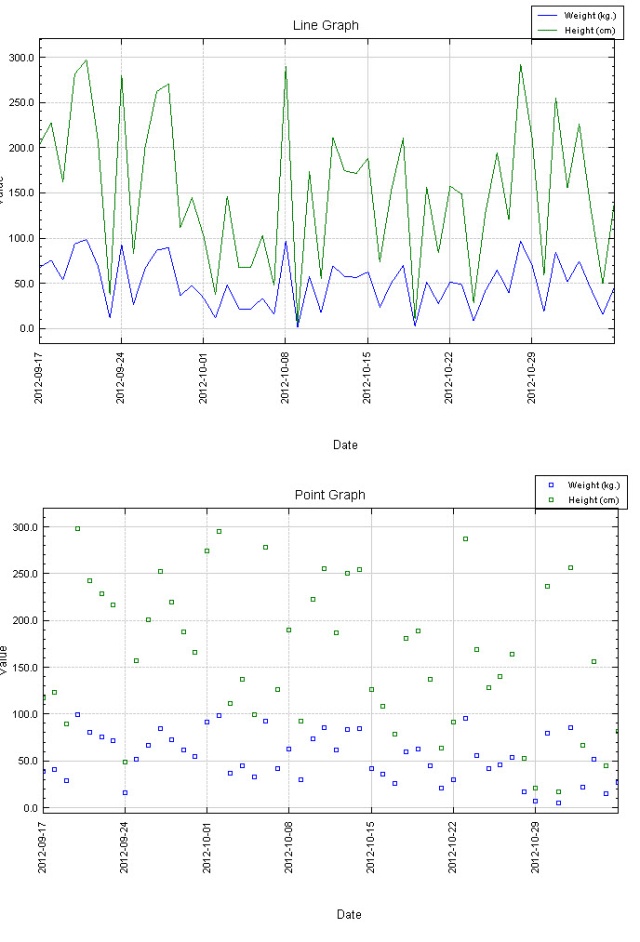
Draw line graph
private void CreateLineGraph()
{
NPlot.Bitmap.PlotSurface2D npSurface = new NPlot.Bitmap.PlotSurface2D(700, 500);
NPlot.LinePlot npPlot1 = new LinePlot();
NPlot.LinePlot npPlot2 = new LinePlot();
NPlot.LinePlot npPlot3 = new LinePlot();
Font TitleFont = new Font("Arial", 12);
Font AxisFont = new Font("Arial", 10);
Font TickFont = new Font("Arial", 8);
NPlot.Legend npLegend = new NPlot.Legend();
DateTime[] X1 = new DateTime[50];
DateTime[] X2 = new DateTime[50];
int[] Y1 = new int[50];
int[] Y2 = new int[50];
Random r1 = new Random();
Random r2 = new Random();
for (int i = 0; i < 50; i++)
{
X1[i] = DateTime.Now.Date.AddDays(i);
X2[i] = DateTime.Now.Date.AddDays(i);
Y1[i] = r1.Next(100);
Y2[i] = r2.Next(300);
}
npSurface.Clear();
npSurface.Title = "Line Graph";
npSurface.BackColor = System.Drawing.Color.White;
NPlot.Grid p = new Grid();
npSurface.Add(p, NPlot.PlotSurface2D.XAxisPosition.Bottom,
NPlot.PlotSurface2D.YAxisPosition.Left);
npPlot1.AbscissaData = X1;
npPlot1.DataSource = Y1;
npPlot1.Label = "Weight (kg.)";
npPlot1.Color = System.Drawing.Color.Blue;
npPlot2.AbscissaData = X2;
npPlot2.DataSource = Y2;
npPlot2.Label = "Height (cm)";
npPlot2.Color = System.Drawing.Color.Green;
npSurface.Add(npPlot1, NPlot.PlotSurface2D.XAxisPosition.Bottom,
NPlot.PlotSurface2D.YAxisPosition.Left);
npSurface.Add(npPlot2, NPlot.PlotSurface2D.XAxisPosition.Bottom,
NPlot.PlotSurface2D.YAxisPosition.Left);
npSurface.XAxis1.Label = "Date";
npSurface.XAxis1.NumberFormat = "yyyy-MM-dd";
npSurface.XAxis1.TicksLabelAngle = 90;
npSurface.XAxis1.TickTextNextToAxis = true;
npSurface.XAxis1.FlipTicksLabel = true;
npSurface.XAxis1.LabelOffset = 110;
npSurface.XAxis1.LabelOffsetAbsolute = true;
npSurface.XAxis1.LabelFont = AxisFont;
npSurface.XAxis1.TickTextFont = TickFont;
npSurface.YAxis1.Label = "Value";
npSurface.YAxis1.NumberFormat = "{0:####0.0}";
npSurface.YAxis1.LabelFont = AxisFont;
npSurface.YAxis1.TickTextFont = TickFont;
npLegend.AttachTo(NPlot.PlotSurface2D.XAxisPosition.Top,
NPlot.PlotSurface2D.YAxisPosition.Right);
npLegend.VerticalEdgePlacement = NPlot.Legend.Placement.Inside;
npLegend.HorizontalEdgePlacement = NPlot.Legend.Placement.Outside;
npLegend.BorderStyle = NPlot.LegendBase.BorderType.Line;
npSurface.Legend = npLegend;
npSurface.Refresh();
Response.Buffer = true;
Response.ContentType = "image/gif";
MemoryStream memStream = new MemoryStream();
npSurface.Bitmap.Save(memStream, System.Drawing.Imaging.ImageFormat.Gif);
memStream.WriteTo(Response.OutputStream);
Response.End();
}
Draw point graph
private void CreatePointGraph()
{
NPlot.Bitmap.PlotSurface2D npSurface = new NPlot.Bitmap.PlotSurface2D(700, 500);
NPlot.PointPlot npPlot1 = new PointPlot();
NPlot.PointPlot npPlot2 = new PointPlot();
NPlot.PointPlot npPlot3 = new PointPlot();
Font TitleFont=new Font("Arial", 12);
Font AxisFont=new Font("Arial", 10);
Font TickFont=new Font("Arial", 8);
NPlot.Legend npLegend = new NPlot.Legend();
DateTime[] X1 = new DateTime[50];
DateTime[] X2 = new DateTime[50];
int[] Y1 = new int[50];
int[] Y2 = new int[50];
Random r1 = new Random();
Random r2 = new Random();
for (int i = 0; i < 50; i++)
{
X1[i] = DateTime.Now.Date.AddDays(i);
X2[i] = DateTime.Now.Date.AddDays(i);
Y1[i] = r1.Next(100);
Y2[i] = r2.Next(300);
}
npSurface.Clear();
npSurface.Title = "Point Graph";
npSurface.BackColor = System.Drawing.Color.White;
NPlot.Grid p = new Grid();
npSurface.Add(p, NPlot.PlotSurface2D.XAxisPosition.Bottom,
NPlot.PlotSurface2D.YAxisPosition.Left);
npPlot1.AbscissaData = X1;
npPlot1.DataSource = Y1;
npPlot1.Label = "Weight (kg.)";
npPlot1.Marker.Color = System.Drawing.Color.Blue;
npPlot2.AbscissaData = X2;
npPlot2.DataSource = Y2;
npPlot2.Label = "Height (cm)";
npPlot2.Marker.Color = System.Drawing.Color.Green;
npSurface.Add(npPlot1, NPlot.PlotSurface2D.XAxisPosition.Bottom,
NPlot.PlotSurface2D.YAxisPosition.Left);
npSurface.Add(npPlot2, NPlot.PlotSurface2D.XAxisPosition.Bottom,
NPlot.PlotSurface2D.YAxisPosition.Left);
npSurface.XAxis1.Label = "Date";
npSurface.XAxis1.NumberFormat = "yyyy-MM-dd";
npSurface.XAxis1.TicksLabelAngle = 90;
npSurface.XAxis1.TickTextNextToAxis = true;
npSurface.XAxis1.FlipTicksLabel = true;
npSurface.XAxis1.LabelOffset = 110;
npSurface.XAxis1.LabelOffsetAbsolute = true;
npSurface.XAxis1.LabelFont = AxisFont;
npSurface.XAxis1.TickTextFont = TickFont;
npSurface.YAxis1.Label = "Value";
npSurface.YAxis1.NumberFormat = "{0:####0.0}";
npSurface.YAxis1.LabelFont = AxisFont;
npSurface.YAxis1.TickTextFont = TickFont;
npLegend.AttachTo(NPlot.PlotSurface2D.XAxisPosition.Top,
NPlot.PlotSurface2D.YAxisPosition.Right);
npLegend.VerticalEdgePlacement = NPlot.Legend.Placement.Inside;
npLegend.HorizontalEdgePlacement = NPlot.Legend.Placement.Outside;
npLegend.BorderStyle = NPlot.LegendBase.BorderType.Line;
npSurface.Legend = npLegend;
npSurface.Refresh();
Response.Buffer = true;
Response.ContentType = "image/gif";
MemoryStream memStream = new MemoryStream();
npSurface.Bitmap.Save(memStream, System.Drawing.Imaging.ImageFormat.Gif);
memStream.WriteTo(Response.OutputStream);
Response.End();
}
References
Development Status
- There is still some functionality missing that many users would expect from a charting library. NPlot is not yet considered basic feature complete (though it is getting close).
- The API is still subject to change without notice or with regards to backwards compatibility. The focus remains on creating the best library design possible.
- There is no separate development / stable branches of the code. A given release of NPlot may include both bug fixes and significant enhancements. The latter has the
potential to break functionality that was working in a previous release. With the above said, NPlot is known to be used in several production systems. If you only
use the basic functionality of the library, you should find it very reliable.
History
None so far.
