Introduction
As developers, we all need to know about bookmarks, breakpoints, saved/unsaved changes, unused parameters, warnings, errors and find hits inside the current file. This will help us to complete our work quickly and efficiently.
Pre-requisites
- Visual Studio 2019
Parts of the Scroll Bar
- Scroll Bar,
- Top arrow button,
- Bottom Arrow button, and
- Scroll Box (Thumb)
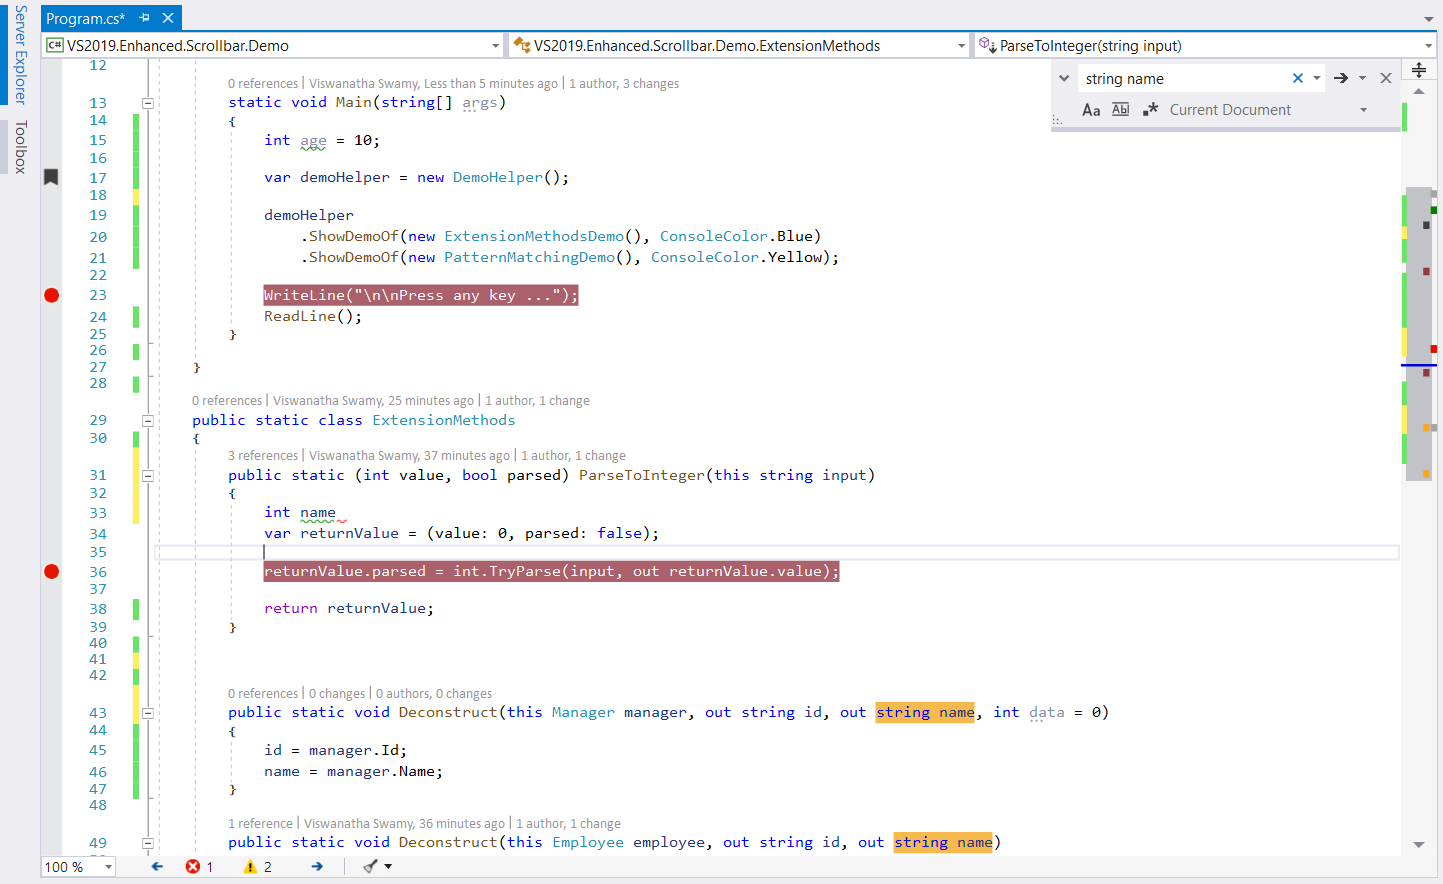
Visual Studio 2019 C# Editor with Scroll Bar (Extreme Right with Few Colored Dots)

Scroll Box (Thumb)
In our sample code, we are viewing Program.cs and it has 55 lines. Scroll Box (Thumb) is the representation of our current Window View, in our case, lines 12 - 49. A blue horizontal line inside the Scroll Box (Thumb) represents the current position where the cursor is placed inside the file. In our case, it is on line 35. Please refer to the image above.
Visual Indicators of Visual Studio 2019 Scroll Bar
Scroll Bar can be divided into 3 visual indicator columns:
- saved/unsaved changes
- bookmarks, breakpoints and find hits; and
- unused parameters, warnings, and errors.
Saved/Unsaved Changes (1st column in Scroll Bar)
When we make any modifications to the current file, you will be seeing a yellow line. Once you save the file, those locations where we modified the code which is in yellow will become green indicating that the current changes are saved. After that, when we make other changes, they will be in yellow. The green/yellow colors on the Scroll Bar will help us in identifying the saved/unsaved changes in the current file. Please refer to the image above.
Bookmarks, Break Points, and Find Hits (2nd column in Scroll Bar)
All the Black dots are the Bookmarks (line 17) in the current file. All the Maroon Dots are Breakpoints (lines 23 and 36) in the current file. All the orange (ok, somewhat orange) are found hits (line 43 and 49 string names). Please refer to the image above.
Unused Parameters, Warnings, and Errors (3rd column in Scroll Bar)
All the unused parameters are indicated by gray dots (line 13 age, line 43 data). All warnings are indicated by green dots (line 15 age). All the errors are indicated by red dots (line 33 name). We can have a quick glance at the scroll bar to ensure that our current file does not have any errors by looking into the scroll bar, before even building the solution to find the errors. Please refer to the image above.
Once we fix any issue and execute the sample code, it should display the output.

Summary
We can use Visual Studio 2019’s scroll bar as the map of the entire current file. Each dot is giving us a piece of information to make our life easy.
History
- 9th July, 2019: Initial version
