Introduction
When I am slugging away in some JavaScript or web app or whatever, I am sure I am like a large number of people and throw/sprinkle console.log into the code so I can see the various stages, or what function is receiving or what a function is away to return, etc. and can follow what is going on in the console as I am clicking away or doing whatever I am writing/testing.
How many times have you seen in the output [object Object] appear, and you are like AAARGHH!
You then go and spend time messing around with stringify or other code to make it readable.
Well, I ONLY found out yesterday, and that probably the whole world knows and I maybe missed the memo, but.........
Using the Code
.....if you change the console.log statement to look something like:
console.log("Result is: %O", theObject) where you guessed it, theObject is the thing you want to see, and note that it is a %O for Object not a 0 (zero).
As an example, if I open up Chrome DevTools and go to the console and enter: (I picked at random one of the inbuilt objects, try it with some others.)
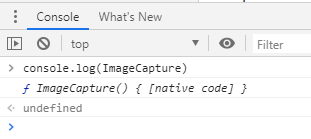
console.log(ImageCapture)

You are returned with some text and reference to native code and not a lot you can inspect.
However, if I put in:
console.log("Image Capture: %O", ImageCapture)
You can see, I can now start drilling down into the ImageCapture object:

So, before you start sprinkling your code with extra stuff to see what's in an object, maybe take %O for a spin!
Update 14-Aug-2019: I went looking at the Mozilla specifications for console, and there is actually a specific method for doing this, dir().
So, if you were to do console.dir(ImageCapture), you would get the drill down view of the object. See, every day is a school day!
For more information on the console specification from Mozilla, and the numerous other methods that can be applied, visit this link.
Points of Interest
Every day is a school day!
History
- 14th August, 2019 - Updated with
dir() info and Mozilla link - 13th August, 2019 - First published
