Introduction
A chart is a representation of data that helps you visualize data graphically than in a table. Charts are generally used over table to ease the understanding of data, trend, relation between the data, etc. For example: understanding and analyzing the data is not easier if you are trying to show number of visitors every minute. Instead using a chart would make it easy to understand data and the trend. At the same time, automating to add the latest live user data every second / minute is a great option. To show updated data to the user, real-time charts are used. This type of charts are also referred to as dynamic charts or live charts as they update data dynamically.

Background
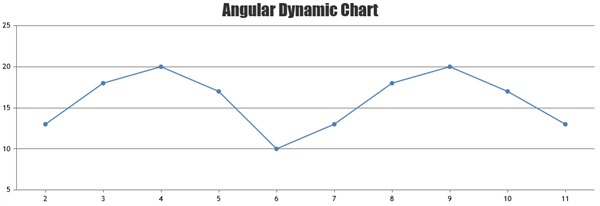
Drawing dynamic charts/graphs in Angular application has been made easy with the JavaScript package called CanvasJS. In this example, I will use CanvasJS angular chart component to create a dynamic chart. CanvasJS is one of the popular charting library that supports various features along with adding / modifying data dynamically. I'm using random data to keep the example simple & make it easy to understand.
Using the Code
Below is the Angular code for dynamic chart using CanvasJS angular chart component.
/* app.component.html */
<canvasjs-chart
  [options]="chartOptions"
  [styles]="{ width: '100%', height: '360px' }"
  (chartInstance)="getChartInstance($event)"
></canvasjs-chart>
import { Component } from '@angular/core';
@Component({
selector: 'my-app',
templateUrl: './app.component.html'
})
export class AppComponent {
dps = [
{ x: 1, y: 10 },
{ x: 2, y: 13 },
{ x: 3, y: 18 },
{ x: 4, y: 20 },
{ x: 5, y: 17 },
{ x: 6, y: 10 },
{ x: 7, y: 13 },
{ x: 8, y: 18 },
{ x: 9, y: 20 },
{ x: 10, y: 17 },
];
chart: any;
chartOptions = {
exportEnabled: true,
title: {
text: 'Angular Dynamic Chart',
},
data: [
{
type: 'line',
dataPoints: this.dps,
},
],
};
getChartInstance(chart: object) {
this.chart = chart;
setTimeout(this.updateChart, 1000);
}
updateChart = () => {
var yVal =
this.dps[this.dps.length - 1].y +
Math.round(5 + Math.random() * (-5 - 5));
this.dps.push({ x: this.dps[this.dps.length - 1].x + 1, y: yVal });
if (this.dps.length > 10) {
this.dps.shift();
}
this.chart.render();
setTimeout(this.updateChart, 1000);
};
}
import { NgModule } from '@angular/core';
import { BrowserModule } from '@angular/platform-browser';
import { FormsModule } from '@angular/forms';
import { AppComponent } from './app.component';
import * as CanvasJSAngularChart from '../assets/canvasjs.angular.component';
var CanvasJSChart = CanvasJSAngularChart.CanvasJSChart;
@NgModule({
imports: [BrowserModule, FormsModule],
declarations: [AppComponent, CanvasJSChart],
bootstrap: [AppComponent],
})
export class AppModule {}
Step by Step Instructions
To add dynamic chart to your angular application / dashboard, first your app should be ready. If you don't have one, create a simple angular app. Once the app is built & ready, let's continue adding dynamic chart to it.
-
Add Chart Component
You can create Angular chart component with necessary details to be shown in chart like chart-title, axis ranges, axis title, labels, etc. to the component as options.
<canvasjs-chart
      [options]="chartOptions"
      [styles]="{ width: '100%', height: '360px' }"
></canvasjs-chart>
export class AppComponent {
      chartOptions = {
            title: {
                text: "Angular Dynamic Chart"
            },
            axisY: {
                title: "Y Axis"
                .
                .
                .
            }
            .
            .
            .
      }
}
-
Add some initial set of datapoints to be shown in the chart
dps = [{x: 1, y: 10}, {x: 2, y: 13}, {x: 3, y: 18}, {x: 4, y: 20},
{x: 5, y: 17},{x: 6, y: 10}, {x: 7, y: 13}, {x: 8, y: 18},
{x: 9, y: 20}, {x: 10, y: 17}];
-
Add new datapoint every second & update the chart
setInterval(function () {
    this.dps.push({ x: this.dps[this.dps.length - 1].x + 1, y: yVal });
    this.chart.render();
}, 1000);
-
Shift Data
As we introduce new datapoints every second, the accumulated data-set looks large. We can remove older data to show just recent data. As CanvasJS accepts datapoints as array, you can remove older data using shift() method.
if (this.dps.length > 10) {
    this.dps.shift();
}
Points of Interest
- Angular Dynamic Charts using
CanvasJS chart component
History
- 27th July, 2022: Initial version
