Introduction
If you're developing Windows store application in JavaScript (WinJS), and find the need to reference a module or a piece of code written in C#, then Visual Studio allows you to do so by referencing a Windows Runtime Component Project (written in C#) into your WinJS application. In fact, there is a walkthrough on MSDN that explains just that. However, the problem is when Exceptions occur!
For example, let's say I create a C# runtime component named OddCalculator (odd because it only accepts Odd numbers!) that looks like this:
public sealed class OddCalculator
{
    public int Add(int i, int j)
    {
        if (i%2 == 0 || j%2 == 0)
            throw new ArgumentException("Only Odd numbers!");

        return i + j;
    }
}
Then if I consume it from within my WinJS application by passing invalid arguments (any number that is not odd, in this case 4):
(function () {
"use strict";
WinJS.Binding.optimizeBindingReferences = true;
var app = WinJS.Application;
var activation = Windows.ApplicationModel.Activation;
app.onactivated = function (args) {
var oddCalculator = new WindowsRuntimeComponent.OddCalculator();
var result = oddCalculator.add(4, 7);
console.log(result);
};
app.start();
})();
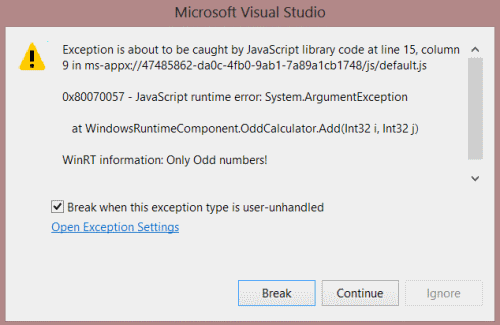
Then the Script debugger will capture the exception and break at the add(4, 7) statement. The problem is what if I want to break inside the Windows runtime component project? What if I need to see the stack call of that code?

We can achieve this by changing the debugger settings in the Windows store project properties and select Mixed(Managed and Native) in the Debugger Type.

So now the debugger will break inside the Windows runtime project and we will have access to all the internal properties of the OddCalculator class giving a more conducive debugging experience.

