Introduction
The term Business Intelligence is always a buzz word in every organization dealing with lots of data. Be it schools, marketing agencies, financial institutions dealing with day to day market changes, sales, inventory – everyone needs data. This data need to be analyzed and presented to make vital information. There are lots of tools in the market that deal with providing this information. Some of them include QlikView, Monarch, etc. Every software has its own capabilities and features. Microsoft has come up with a software, “PowerPivot” to deal with this on a simpler basis and to bring Business Intelligence to the masses. PowerPivot is a powerful data mashup and data exploration tool based on xVelocity in-memory technologies providing unmatched analytical performance to process billions of rows at the speed of thought. This tip would explain various features of PowerPivot and ways to utilize them.
Background
On 12 May 2010, Microsoft introduced SQL Server PowerPivot, an Excel-based data discovery tool giving business users the ability to combine and analyze large amounts of diverse data.
- SQL Server PowerPivot is a data discovery tool, including powerful data mashup capabilities, an xVelocity in-memory repository and basic visualization tools, that gives business users the ability to combine and analyze large amounts of diverse data. PowerPivot workbooks can be shared with other users through SharePoint 2010 and SQL Server 2008 R2.
- PowerPivot's most differentiating feature, compared with other data discovery tools (such as QlikView, Tibco Spotfire and Tableau), is its end-user data mashup capability. However, PowerPivot lacks those products' range of visualizations and interactivity. Microsoft included just enough data slicers and filtering functionality in the initial release to qualify as a limited interactive visualization tool.
PC World Magazine says it this way: As the name implies, PowerPivot is a PivotTable on steroids. With PowerPivot, you can pull into Excel large amounts of data from multiple database tables, databases or other sources of data, and sort and filter them almost instantly. Data can be reorganized around one column or compared against columns from another data source. You can divide the data by time, geographic origin or some other parameter. Since it runs Microsoft's business intelligence software on the back end, it can do much of what a full-fledged BI application can do.
Gartner says: Microsoft Excel has been widely used for data aggregation and lightweight analysis, but limitations have precluded its use as a high-end ad hoc analysis tool, including limits to the data size it can handle and the number of rows it offers, its slow calculations, its lack of understanding of dimensional models and its lack of centralized spreadsheet management and control. ….. PowerPivot begins to address this limitation …... extending interactive analysis capabilities to Excel "power users."
Installing PowerPivot
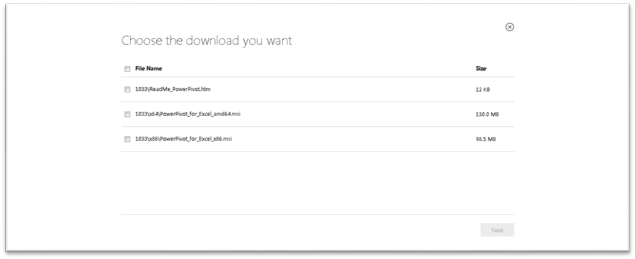
PowerPivot can be downloaded in Microsoft site at http://www.microsoft.com/en-us/download/details.aspx?id=29074.

Select the appropriate file and install PowerPivot. Once the installation is complete, you should be able to see PowerPivot in your Microsoft Excel 2010 Ribbon as shown below:

Working with PowerPivot
Let’s start with creating a simple PowerPivot having another Excel file as data source. Let us consider the sales data across different time frames from various regions. (I am not including the entire data for our understanding purposes.)

Click “PowerPivot Window” found at the top left corner in the ribbon. Once the screen got generated, our next step is to select the data source. The data source can be from SQL Server, SQL Server Reports (.rdl) files, from any data sources from Azure, from any Data feeds – Open Data sources and it can also be from any text files or Excel files. Let's see couple of these in this tip.
Click on “From Other Sources” and you should be seeing a popup window just like the one shown below. Select “Excel File” from “Text Files” section, and then click “Next”.

Select the Excel file which has the data. Please find link to several sample files under References section. The first row has the headings here.

Select the tabs / sheets from which you would need to import data. You can actually import data from multiple sheets and define relationships among them.

Now, you can start creating your charts as you would normally do with your Pivot Tables and Pivot Charts.

Refer to the simple table and chart created for the provided data.

Now, let us see how to import data from Data Feeds using some online open data sources. From the data source, select “From Data Feeds”. In Data Feeds URL provide – https://api.datamarket.azure.com/mapmechanics/GB_Car_Park_Locations/v1/.

Once you have selected the data source, the window imports all the data to its in memory.

Once data is imported, you can then customize your charts as you wish. I have shown the below report where I am filtering based on postal code to see how many parking slots are currently available along with the summary of total parking lots existing.

References
- www.powerpivot.com
- http://www.pivotdashboard.com/Pages/WhyPowerPivot.aspx
- http://powerpivotsdr.codeplex.com/releases/view/46355
