Introduction
Charts are used to present the data in graphical representation. When the data is represented graphically, it becomes easy to understand and manipulate. Users can create various types of charts in an Excel file using Office Automation. Some people find it difficult to work with Office Automation, so I’ll share an alternative method to create a pie chart with sample data as well.
Inserting Sample Data in a Worksheet
The following code inserts headings and sample data in Excel worksheet using the Office Automation. It also sets the font size and makes the text bold, and adds some countries along with number of users sample data for a pie chart.
sheet.Cells[1, 1] = "Country";
sheet.Cells[1, 2] = "Users";
sheet.Cells[1, 1].Font.Bold = true;
sheet.Cells[1, 2].Font.Bold = true;
sheet.Cells[1, 1].Font.Size = 13;
sheet.Cells[1, 2].Font.Size = 13;
sheet.Cells[2, 1] = "England";
sheet.Cells[2, 2] = 10000;
sheet.Cells[3, 1] = "USA";
sheet.Cells[3, 2] = 8000;
sheet.Cells[4, 1] = "China";
sheet.Cells[4, 2] = 12000;
sheet.Cells[5, 1] = "Russia";
sheet.Cells[5, 2] = 9000;
sheet.Cells[6, 1] = "India";
sheet.Cells[6, 2] = 7000;
Creating a Pie Chart using Office Automation
In the following lines of code, I create an Excel chart. I set its chart type as Pie Chart. I also set its title properties and source data range. Finally, I save the workbook.
Microsoft.Office.Tools.Excel.Chart usersChart;
usersChart = sheet.Controls.AddChart(0, 105, 330, 200, "CountryUsers");
usersChart.ChartType = Microsoft.Office.Interop.Excel.XlChartType.xlPie;
usersChart.HasTitle = true;
usersChart.ChartTitle.Text = "Users";
Microsoft.Office.Interop.Excel.Range chartRange = sheet.get_Range("A2", "B6");
usersChart.SetSourceData(chartRange, missing);
Microsoft.Office.Interop.Excel.Workbook workbook = sheet.Application.ActiveWorkbook;
workbook.SaveCopyAs("F:\\Downloads\\Output.xlsx");

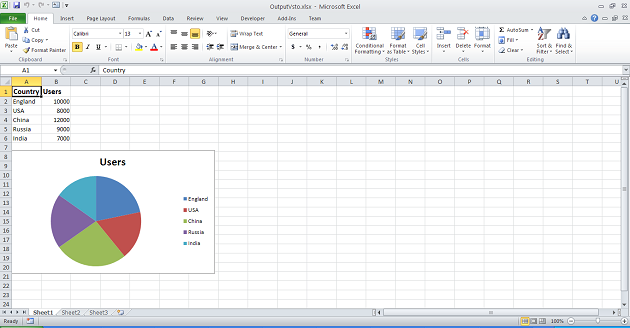
Figure 1: Excel Output of Microsoft Office Automation
Conclusion
We have finally created an Excel file with data and a pie chart as shown in above figure. Office Automation (VSTO) has its own stability and performance issues so if you don’t want to use Office Automation on server side to generate Excel charts, then you may also use Open XML SDK from Microsoft which doesn’t require Microsoft Office to be installed on server. And if you find using Open XML SDK complicated, then you may also try some commercial Excel library that addresses all concerns of Office Automation and Open XML SDK.
Good luck and happy coding!
