Visual Studio 2010 has now a better feature in terms of Bookmarks. A team can now collaborate bookmarks between them by using the import/export bookmarks. You can now pin the debug value so that you can access it in later point of time, also you can now add a label to your bookmark.

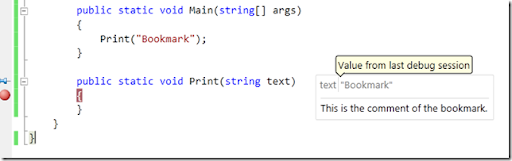
Lets give a brief idea on this. Suppose, you are debugging your module & while debugging you found an issue in another’s module and want to let him know that there is a bug in his code and creating issues in your module. Just sending out an information requires debugging to the code again & finding out the issue by the another team member. Now in VS2010 IDE, you can now pin the debug value and export that bookmark with proper comments as an XML & send it out to your another team member. Once he imports it to his IDE, he can see the bookmark with the debug value available from the last session. From this point he can debug the root cause instead of finding out the area again. This is very useful in terms of collaborating debug information with the team.
The only thing that I don’t like here is, the XML which uses line number to store the breakpoint information. If the code has been modified in the other member side, it will not work correctly. The only requirements of the import/export to work correctly is “There should not be any modification in the shared code file”.

