Introduction
The objective of this FAQ is to outline the basic steps in troubleshooting high CPU utilization on a server hosting a SQL Server instance.
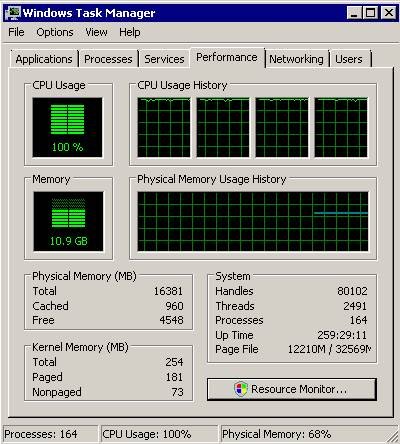
The first and the most common step if you suspect high CPU utilization (or are alerted for it) is to login to the physical server and check the Windows Task Manager. The Performance tab will show the high utilization as shown below:

Next, we need to determine which process is responsible for the high CPU consumption. The Processes tab of the Task Manager will show this information:

Note that to see all processes, you should select Show processes from all users.
In this case, SQL Server (sqlserver.exe) is consuming 99% of the CPU (a normal benchmark for max CPU utilization is about 50-60%).
Next, we examine the scheduler data. Scheduler is a component of SQLOS which evenly distributes load amongst CPUs. The query below returns the important columns for CPU troubleshooting.
Note: If your server is under severe stress and you are unable to login to SSMS, you can use another machine’s SSMS to login to the server through DAC – Dedicated Administrator Connection (see this link for details on using DAC).
SELECT  scheduler_id
        ,cpu_id
        ,status
        ,runnable_tasks_count
        ,active_workers_count
        ,load_factor
        ,yield_count
FROM sys.dm_os_schedulers
WHERE scheduler_id < 255

See below for the BOL definitions for the above columns:
scheduler_id – ID of the scheduler. All schedulers that are used to run regular queries have ID numbers less than 1048576. Those schedulers that have IDs greater than or equal to 1048576 are used internally by SQL Server, such as the dedicated administrator connection scheduler.cpu_id – ID of the CPU with which this scheduler is associated.status – Indicates the status of the scheduler.runnable_tasks_count – Number of workers, with tasks assigned to them that are waiting to be scheduled on the runnable queue.active_workers_count – Number of workers that are active. An active worker is never preemptive, must have an associated task, and is either running, runnable, or suspended.current_tasks_count - Number of current tasks that are associated with this scheduler.load_factor – Internal value that indicates the perceived load on this scheduler.yield_count – Internal value that is used to indicate progress on this scheduler.
Now to interpret the above data. There are four schedulers and each assigned to a different CPU. All the CPUs are ready to accept user queries as all of them are ONLINE.
There are 294 active tasks in the output as per the current_tasks_count column. This count indicates how many activities are currently associated with the schedulers. When a task is complete, this number is decremented. The 294 is quite a high figure and indicates all four schedulers are extremely busy.
When a task is enqueued, the load_factor value is incremented. This value is used to determine whether a new task should be put on this scheduler or another scheduler. The new task will be allocated to less loaded scheduler by SQLOS. The very high value of this column indicates all the schedulers have a high load.
There are 268 runnable tasks which mean all these tasks are assigned a worker and waiting to be scheduled on the runnable queue.
The next step is to identify which queries are demanding a lot of CPU time. The below query is useful for this purpose (note, in its current form, it only shows the top 10 records).
SELECT TOP 10 st.text
               ,st.dbid
               ,st.objectid
               ,qs.total_worker_time
               ,qs.last_worker_time
               ,qp.query_plan
FROM sys.dm_exec_query_stats qs
CROSS APPLY sys.dm_exec_sql_text(qs.sql_handle) st
CROSS APPLY sys.dm_exec_query_plan(qs.plan_handle) qp
ORDER BY qs.total_worker_time DESC
This query has total_worker_time as the measure of CPU load and is in descending order of the total_worker_time to show the most expensive queries and their plans at the top:
Note the BOL definitions for the important columns:
total_worker_time - Total amount of CPU time, in microseconds, that was consumed by executions of this plan since it was compiled.last_worker_time - CPU time, in microseconds, that was consumed the last time the plan was executed.

I re-ran the same query again after a few seconds and was returned the below output.

