Introduction
In this article, we can see how to create a simple Dynamic Project Scheduling from a database using a Stored Procedure with Pivot result. Display the result to MVC view using AngularJS and Web API 2 without using Entity Framework.
In this example, I didn't use Entity Framework. The reason for not using EF is because for EF, we need to get the result of the select with fixed columns (the columns need to be defined), for example, from our Stored Procedure, we usually do a select result like “select column1,column2,column3 from table”. But for our example, I have used the pivot result and the columns will be displayed dynamically depending on the date range and I am using the “exec sp_executesql @SQLquery;” in my SP to execute the dynamic query. Instead of using the Entity Framework in my Web API, I will be connecting to the database directly and execute the SP to return the result. From my AngularJS Controller, I will call the Web API method to return the result.
Project Scheduling
Project Scheduling is a very important part in project planning. The project might be any type, for example, software project development planning, production planning and so on. For a realistic example, let's consider a car seat manufacturing company. Every week, they will produce, for example, 100 sets of seats for a model of car. In the factory, everything will go as planned, for example, from this week beginning Monday to this week ending Friday, a total of 100 seats need to be manufactured and delivered to the customer. Here, we can see this is the plan since we need to produce 100 seats and deliver them to the customer. But for some reason, the production could only make 90 sets of seats or production has made 100 set of seats in time. To track the production plan with the actual plan, we use the Production Schedule Chart. The production plan will have both a start and end date, when the production must be started and when the production needs to be finished. The actual date is the real production start and the end date. The actual start and end dates will be set after the production is completed. If the actual date is the same or below the production end date, then it's clear that the production is on time and it can be delivered to the customer. If the actual end date is past the production plan date, then the production line must be closely watched and again the next time, the same delay should be avoided.
In the project, there might be 2 dates available, one is the scheduled start and end dates (this is the initial planned date or the target date for our project) and another one is the actual start and end date (this is when the project is actually started and completed). For all the projects, we need to compare both the scheduled and actual dates, if there are greater differences in both of the dates, then we need to check whether the project is completed within the scheduled time or if there was a delay in project development.
You can also view my previous articles related to AngularJs using MVC and the WCF Rest Service.
Previous articles related to Angular JS,MVC and WEB API:
Using the Code
Create Database and Table
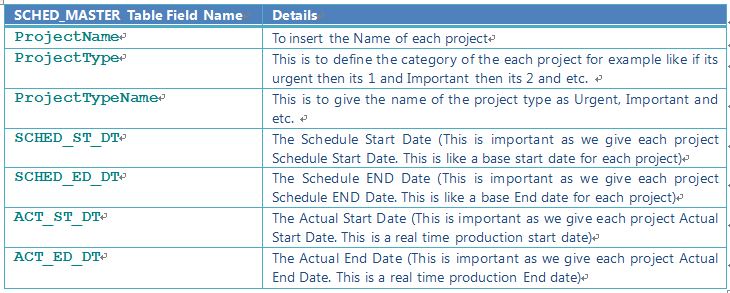
We will create a SCHED_Master table under the database 'projectDB'. The following is the script to create a database, table and sample insert query. Run this script in your SQL Server. I have used SQL Server 2012.
USE MASTER
GO
IF EXISTS (SELECT [name] FROM sys.databases WHERE [name] = 'projectDB' )
DROP DATABASE projectDB
GO
CREATE DATABASE projectDB
GO
USE projectDB
GO
CREATE TABLE [dbo].[SCHED_Master](
[ID] [int] NOT NULL,
[ProjectName] [varchar](100) NULL,
[ProjectType] int NULL,
[ProjectTypeName] [varchar](100) NULL,
[SCHED_ST_DT] [datetime] NULL,
[SCHED_ED_DT] [datetime] NULL,
[ACT_ST_DT] [datetime] NULL,
[ACT_ED_DT] [datetime] NULL,
[status] int null
PRIMARY KEY CLUSTERED
(
[ID] ASC
)WITH (PAD_INDEX = OFF, STATISTICS_NORECOMPUTE = OFF, _
IGNORE_DUP_KEY = OFF, ALLOW_ROW_LOCKS = ON, ALLOW_PAGE_LOCKS = ON) ON [PRIMARY]
) ON [PRIMARY]
INSERT INTO [dbo].SCHED_Master
([ID],[ProjectName],[ProjectType],[ProjectTypeName],_
[SCHED_ST_DT],[SCHED_ED_DT],[ACT_ST_DT],[ACT_ED_DT],[status])
VALUES
(1001,'Project1',1,'Urgent','2015-06-01 00:00:00.000','2015-09-02 00:00:00.000'
,'2015-06-22 00:00:00.000','2015-08-26 00:00:00.000',1)
INSERT INTO [dbo].SCHED_Master
([ID],[ProjectName],[ProjectType],[ProjectTypeName],_
[SCHED_ST_DT],[SCHED_ED_DT],[ACT_ST_DT],[ACT_ED_DT],[status])
VALUES
(1002,'Project1',2,'Important','2015-09-22 00:00:00.000','2015-12-22 00:00:00.000'
,'2015-09-19 00:00:00.000','2015-12-29 00:00:00.000',1)
INSERT INTO [dbo].SCHED_Master
([ID],[ProjectName],[ProjectType],[ProjectTypeName],_
[SCHED_ST_DT],[SCHED_ED_DT],[ACT_ST_DT],[ACT_ED_DT],[status])
VALUES
(1003,'Project1',3,'Normal','2016-01-01 00:00:00.000','2016-03-24 00:00:00.000'
,'2016-01-01 00:00:00.000','2016-03-14 00:00:00.000',1)
INSERT INTO [dbo].SCHED_Master
([ID],[ProjectName],[ProjectType],[ProjectTypeName],_
[SCHED_ST_DT],[SCHED_ED_DT],[ACT_ST_DT],[ACT_ED_DT],[status])
VALUES
(1004,'Project2',1,'Urgent','2015-07-01 00:00:00.000','2015-09-02 00:00:00.000'
,'2015-07-22 00:00:00.000','2015-08-26 00:00:00.000',1)
INSERT INTO [dbo].SCHED_Master
([ID],[ProjectName],[ProjectType],[ProjectTypeName],_
[SCHED_ST_DT],[SCHED_ED_DT],[ACT_ST_DT],[ACT_ED_DT],[status])
VALUES
(1005,'Project2',2,'Important',_
'2015-09-29 00:00:00.000','2015-12-22 00:00:00.000'
,'2015-09-08 00:00:00.000','2015-12-14 00:00:00.000',1)
INSERT INTO [dbo].SCHED_Master
([ID],[ProjectName],[ProjectType],[ProjectTypeName],_
[SCHED_ST_DT],[SCHED_ED_DT],[ACT_ST_DT],[ACT_ED_DT],[status])
VALUES
(1006,'Project2',3,'Normal','2016-01-01 00:00:00.000','2016-03-04 00:00:00.000'
,'2016-01-01 00:00:00.000','2016-02-24 00:00:00.000',1)
select ID,ProjectName,ProjectType,ProjectTypeName,SCHED_ST_DT,_
SCHED_ED_DT,ACT_ST_DT,ACT_ED_DT,status from SCHED_Master
After creating our table, we will create a Stored Procedure to display the project schedule result using a Pivot query.
I will explain each step of my procedure so that you can understand it clearly to make your own with your table formats.
Step 1
Create the procedure with a parameter and declare the variable inside the procedure to be used in the SP.
Note here that I have set the Fromdate and Todate as static. You can change this as a parameter from SP to get the dynamic results depending on your date range.
Alter PROCEDURE [dbo].[usp_ProjectSchedule_Select]
@projectId VARCHAR(10) = ''
AS
BEGIN
Declare @FromDate VARCHAR(20) = '2015-06-08'
Declare @ToDate VARCHAR(20) = '2016-05-06'
DECLARE @MyColumns AS NVARCHAR(MAX),
@SQLquery AS NVARCHAR(MAX)
Step 2
We have defined our project start from date and end date. Now we need to search the project schedule result from the given date.The main purpose of the Project Schedule chart is to display the data range as weeks, months, years or days of any one format with a continuous result within the range.To get the continuous result, I will get the days of Sundays from the start and end date. I will display the result as a display of a week so here I have used every week for the Sunday date and stored all the dates to a temp table to display the result.
IF OBJECT_ID('tempdb..#TEMP_EveryWk_Sndays') IS NOT NULL
DROP TABLE #TEMP_EveryWk_Sndays
DECLARE @TOTALCount INT
Select @TOTALCount= DATEDIFF(dd,@FromDate,@ToDate);
WITH d AS
(
SELECT top (@TOTALCount) AllDays = DATEADD(DAY, ROW_NUMBER()
OVER (ORDER BY object_id), REPLACE(@FromDate,'-','')) FROM sys.all_objects
)
SELECT distinct DATEADD(DAY, 1 - DATEPART(WEEKDAY, AllDays), _
CAST(AllDays AS DATE))WkStartSundays ,1 as status
into #TEMP_EveryWk_Sndays
FROM d
where
AllDays <= @ToDate
AND AllDays >= @FromDate
Step 3
I will join the preceding temp table to the actual Schedule table to compare the dates and produce the result. First, I will check for the Schedule result and using the union, I will combine the result to the actual result and insert the final result to another temp table to generate our pivot result.

Note
For the actual data in the Pivot list, I will display the result as:
“-1”: For End Date of both the scheduled and actual result. In my program, I will check for the produced value, if its “-1” then I will display the text as “END” with Red background color to notify the user for the end date of each project.“0”: If the result value is “0”, then it means the days are not in any schedule or actual days so it should be left blank.“1”: If the result is “1” is to indicate as the scheduled start and end days. I will be using Blue to display the schedule days.“2”: If the result is “2” is to indicate the actual start and end days. I will be using Green to display the schedule days.
This is only a sample procedure that provides a sample program for the project schedule. You can customize this table, procedure and program depending on your requirements. You can set your own rule and status to display the result.
IF OBJECT_ID('tempdb..#TEMP_results') IS NOT NULL
DROP TABLE #TEMP_results
SELECT ProjectName,viewtype,ProjectType,resultnew,YMWK
INTO #TEMP_results
FROM(
SELECT
A.ProjectName ProjectName
,'1-Scd' viewtype
A. ProjectType ProjectType
normal and etc
, Case when cast(DATEPART( wk, max(A.SCHED_ED_DT)) as varchar(2)) =
cast(DATEPART( wk, WkStartSundays) as varchar(2)) then -1 else
case when min(A.SCHED_ST_DT)<= F.WkStartSundays AND max(A.SCHED_ED_DT) >= F.WkStartSundays
then 1 else 0 end end resultnew
+'-'+'W'+convert(varchar(2),Case when len(DATEPART( wk, WkStartSundays))='1' then '0'+_
cast(DATEPART( wk, WkStartSundays) as varchar(2)) _
else cast(DATEPART( wk, WkStartSundays) as varchar(2)) END ) _
as 'YMWK'
FROM
SCHED_Master A (NOLOCK)
LEFT OUTER JOIN
#TEMP_EveryWk_Sndays F (NOLOCK) _
ON A.status= F.status
WHERE
A.ProjectName like '%' + @projectId
AND A.status=1
AND A.ProjectType in (1,2,3)
AND A.SCHED_ST_DT <= @ToDate
AND A.SCHED_ED_DT >= @FromDate
GROUP BY
A.ProjectName
, A. ProjectType
,A.SCHED_ED_DT
,F.WkStartSundays
UNION
SELECT
A.ProjectName ProjectName
, A. ProjectType ProjectType
cast(DATEPART( wk, max(A.ACT_ED_DT)) as varchar(2)) = _
cast(DATEPART( wk, WkStartSundays) as varchar(2)) _
then -1 else case when min(A.ACT_ST_DT)<= F.WkStartSundays AND _
max(A.ACT_ED_DT) >= F.WkStartSundays then 2 _
else 0 end end resultnew
, RIGHT(YEAR(WkStartSundays), 2)+'-'+'W'+convert(varchar(2),_
Case when len_
(DATEPART( wk, WkStartSundays))='1' then '0'+ _
cast(DATEPART( wk, WkStartSundays) as varchar(2)) _
else cast(DATEPART( wk, WkStartSundays) _
as varchar(2)) END ) as 'YMWK'
FROM
SCHED_Master A (NOLOCK)
LEFT OUTER JOIN
#TEMP_EveryWk_Sndays F (NOLOCK) _
ON A.status= F.status
WHERE
A.ProjectName like '%' + @projectId
AND A.status=1
AND A.ProjectType in (1,2,3)
AND A.ACT_ST_DT <= @ToDate
AND A.ACT_ED_DT >= @FromDate
GROUP BY
A.ProjectName
, A. ProjectType
,A.SCHED_ED_DT
,F.WkStartSundays
) q
Step 4
Here, I will display the final result using the Pivot query from the final result of temp table result.
select @MyColumns = STUFF((SELECT ',' + QUOTENAME(YMWK)
FROM #TEMP_results
GROUP BY YMWK
ORDER BY YMWK
FOR XML PATH(''), TYPE
).value('.', 'NVARCHAR(MAX)')
,1,1,'')
set @SQLquery = N'SELECT ProjectName,viewtype,ProjectType,' + @MyColumns + N' from
(
SELECT
ProjectName,
viewtype,
ProjectType,
YMWK,
resultnew as resultnew
FROM #TEMP_results
) x
pivot
(
sum(resultnew)
for YMWK in (' + @MyColumns + N')
) p order by ProjectName, ProjectType,viewtype'
exec sp_executesql @SQLquery;
Here is the complete code for the Stored Procedure.
Alter PROCEDURE [dbo].[usp_ProjectSchedule_Select]
@projectId VARCHAR(10) = ''
AS
BEGIN
Declare @FromDate VARCHAR(20) = '2015-06-08'
Declare @ToDate VARCHAR(20) = '2016-05-06'
DECLARE @MyColumns AS NVARCHAR(MAX),
@SQLquery AS NVARCHAR(MAX)
IF OBJECT_ID('tempdb..#TEMP_EveryWk_Sndays') IS NOT NULL
DROP TABLE #TEMP_EveryWk_Sndays
DECLARE @TOTALCount INT
Select @TOTALCount= DATEDIFF(dd,@FromDate,@ToDate);
WITH d AS
(
SELECT top (@TOTALCount) AllDays = DATEADD(DAY, ROW_NUMBER()
OVER (ORDER BY object_id), REPLACE(@FromDate,'-',''))
FROM sys.all_objects
)
SELECT distinct DATEADD(DAY, 1 - DATEPART(WEEKDAY, AllDays), _
CAST(AllDays AS DATE))WkStartSundays ,1 as status
into #TEMP_EveryWk_Sndays
FROM d
where
AllDays <= @ToDate
AND AllDays >= @FromDate
IF OBJECT_ID('tempdb..#TEMP_results') IS NOT NULL
DROP TABLE #TEMP_results
SELECT ProjectName,viewtype,ProjectType,resultnew,YMWK
INTO #TEMP_results
FROM(
SELECT
A.ProjectName ProjectName
,'1-Scd' viewtype
A. ProjectType ProjectType
Case when cast(DATEPART( wk, max(A.SCHED_ED_DT)) _
as varchar(2)) = cast(DATEPART( wk, WkStartSundays) _
as varchar(2)) then -1 else case when min(A.SCHED_ST_DT)<= F.WkStartSundays _
AND max(A.SCHED_ED_DT) _
>= F.WkStartSundays then 1 else 0 end end resultnew
, RIGHT(YEAR(WkStartSundays), 2)+'-'+'W'+convert(varchar(2),_
Case when len(DATEPART( wk, WkStartSundays))='1' then '0'+ _
cast(DATEPART( wk, WkStartSundays) _
as varchar(2)) else cast(DATEPART( wk, WkStartSundays) as varchar(2)) END ) _
as 'YMWK'
FROM
SCHED_Master A (NOLOCK)
LEFT OUTER JOIN
#TEMP_EveryWk_Sndays F (NOLOCK) ON A.status= F.status
WHERE
A.ProjectName like '%' + @projectId
AND A.status=1
AND A.ProjectType in (1,2,3)
AND A.SCHED_ST_DT <= @ToDate
AND A.SCHED_ED_DT >= @FromDate
GROUP BY
A.ProjectName
, A. ProjectType
,A.SCHED_ED_DT
,F.WkStartSundays
UNION
SELECT A.ProjectName ProjectName
,'2-Act' viewtype
, A. ProjectType ProjectType
Case when cast(DATEPART( wk, max(A.ACT_ED_DT)) as varchar(2)) = _
cast(DATEPART( wk, WkStartSundays) _
as varchar(2)) then -1 else_
case when min(A.ACT_ST_DT)<= F.WkStartSundays AND max(A.ACT_ED_DT) >= F.WkStartSundays _
then 2 else 0 end end resultnew
, RIGHT(YEAR(WkStartSundays), 2)+'-'+'W'+convert(varchar(2),Case _
when len(DATEPART( wk, WkStartSundays))='1' then '0'+ _
cast(DATEPART( wk, WkStartSundays) as varchar(2)) else cast(DATEPART( wk, WkStartSundays) _
as varchar(2)) END ) as 'YMWK'
Week of our Schedule which will be displayed as the Column
FROM
SCHED_Master A (NOLOCK)
LEFT OUTER JOIN
#TEMP_EveryWk_Sndays F (NOLOCK) _
ON A.status= F.status
WHERE
A.ProjectName like '%' + @projectId
AND A.status=1
AND A.ProjectType in (1,2,3)
AND A.ACT_ST_DT <= @ToDate
AND A.ACT_ED_DT >= @FromDate
GROUP BY A.ProjectName _
, A. ProjectType ,A.SCHED_ED_DT ,F.WkStartSundays
) q
select @MyColumns = STUFF((SELECT ',' + QUOTENAME(YMWK)
FROM #TEMP_results
GROUP BY YMWK
ORDER BY YMWK
FOR XML PATH(''), TYPE
).value('.', 'NVARCHAR(MAX)')
,1,1,'')
set @SQLquery = N'SELECT ProjectName,viewtype,ProjectType,' + @MyColumns + N' from
(
SELECT
ProjectName,
viewtype,
ProjectType,
YMWK,
resultnew as resultnew
FROM #TEMP_results
) x
pivot
(
sum(resultnew)
for YMWK in (' + @MyColumns + N')
) p order by ProjectName, ProjectType,viewtype'
exec sp_executesql @SQLquery;
END
If we run the procedure, the final output will be like this. Here, we can see I will display the result of every week using the Pivot query.

Create our MVC Web Application in Visual Studio 2015
After installing our Visual Studio 2015, click Start -> Programs -> Select Visual Studio 2015 -> Click Visual Studio 2015 RC. (Now Visual Studio 2015 is available, you can download the latest version.)

Click New -> Project -> Select Web -> ASP.NET Web Application. Select your project location and enter your web application Name.

Select MVC and in Add Folders and Core reference, select the Web API and click OK.

Steps to Add our WEB API Controller
Right click Controllers folder-> Click Add-> Click Controller.

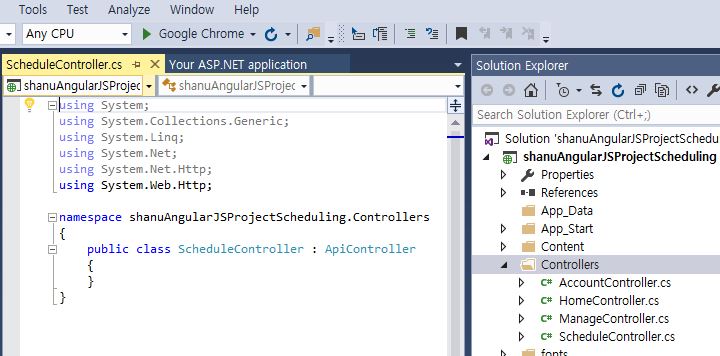
As we are going to create our WEB API Controller, select Controller and Add Empty WEB API 2 Controller. Give Name to Web API controller and click OK. Here for my Web API Controller, I have given name as “ScheduleController”.

As we have created Web API controller, we can see our controller has been inherited from ApiController.
As we all know, Web API is a simple and easy to build HTTP Services for Browsers and Mobiles.
Web API has four methods as Get/Post/Put and Delete where:
Get is to request for the data (Select)Post is to create a data (Insert)Put is to update the dataDelete is to delete data
In our example, we will use both Get as we need to get all Project Schedules.
Get Method
In our example, I have used only Get method as I am using only Stored Procedure. Since I didn’t use the Entity Framework, here I have been connecting to database and get the result of stored procedure to the datatable.
public class scheduleController : ApiController
{
[HttpGet]
public DataTable projectScheduleSelect(string projectID)
{
string connStr = ConfigurationManager.ConnectionStrings_
["shanuConnectionString"].ConnectionString;
DataTable dt = new DataTable();
SqlConnection objSqlConn = new SqlConnection(connStr);
objSqlConn.Open();
SqlCommand command = new SqlCommand("usp_ProjectSchedule_Select", objSqlConn);
command.CommandType = CommandType.StoredProcedure;
command.Parameters.Add("@projectId", SqlDbType.VarChar).Value = projectID;
SqlDataAdapter da = new SqlDataAdapter(command);
da.Fill(dt);
return dt;
}
}
In WebConfig, I have set the database connection string. In Web API get method, I read the connection string and establish the DB Connection. Using the SQL Adapter, get the result from the Stored Procedure by passing the argument and bind the final result to the DataTable and return the DataTable.
Creating AngularJs Controller
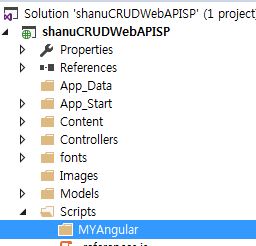
First, create a folder inside the Script folder and I gave the folder name as “MyAngular”.
Now add your Angular Controller inside the folder.
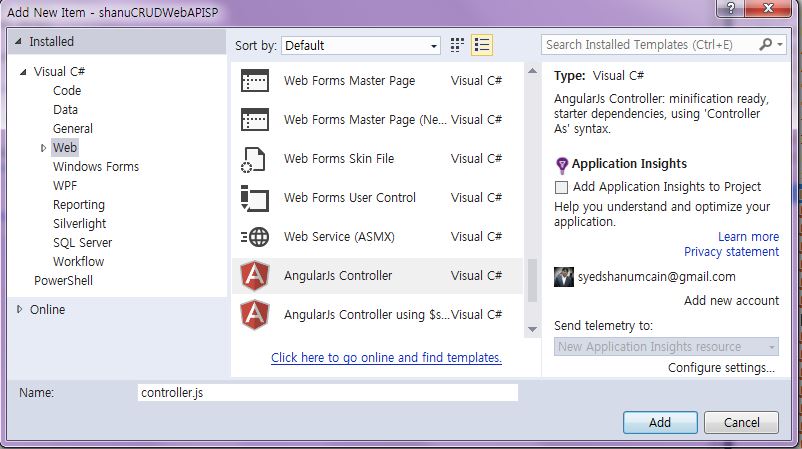
Right click the MyAngular Folder and click Add New Item>Select Web>Select AngularJs Controller and give name to Controller. I have given my AngularJs Controller as “Controller.js”.
Once the AngularJs Controller is created, we can see by default the controller will have the code with default module definition and all.
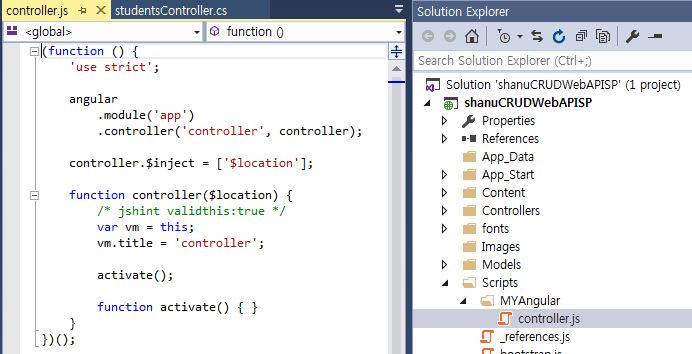
I have changed the above code like adding Module and controller like below.
If the Angular JS package is missing, then add the package to your project.
Right click your MVC project and click-> Manage NuGet Packages. Search for AngularJs and click Install.
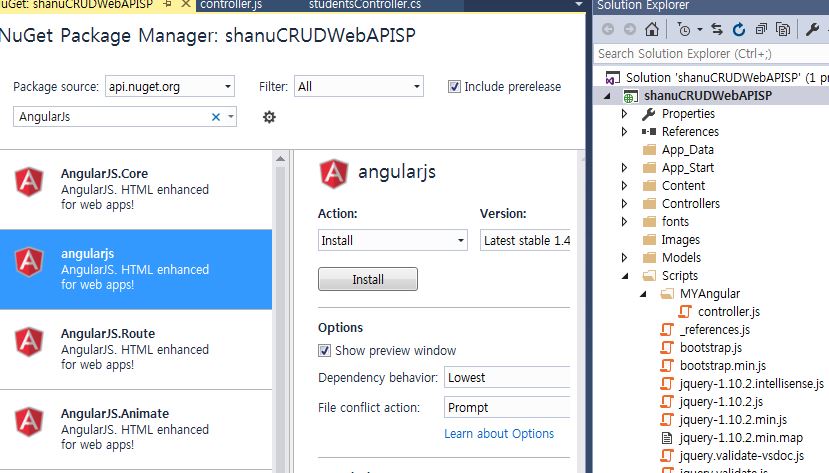
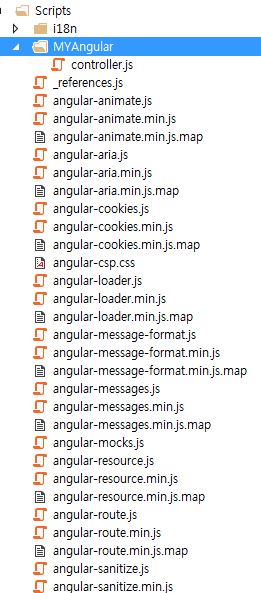
Now we can see all AngularJs packages have been installed and we can see all the files in Script folder.
Steps to Create Angular JS Script Files
Modules.js: Here, we add the reference to the Angular.js JavaScript and create an Angular Module named “RESTClientModule”.
var app;
(function () {
app = angular.module("RESTClientModule", ['ngAnimate']);
})();
Controllers: In Angular JS Controller, I have performed all the business logic and return the data from WEB API to our MVC HTML page.
First, I declared the entire local Variable which needs to be used. I have used only one method “selectScheduleDetails“ in this method, I called WEB API method with Project ID as parameter passing and the returned result I stored in the Angular JS variable to display in the MVC HTML page. In search button click, I will be calling the same method by passing the ProjectID as search parameter.
app.controller("AngularJs_studentsController",
function ($scope, $timeout, $rootScope, $window, $http) {
$scope.date = new Date();
$scope.projectId = "";
selectScheduleDetails($scope.projectId);
function selectScheduleDetails(projectId) {
$http.get('/api/schedule/projectScheduleSelect/',
{ params: { projectId: projectId } }).success(function (data) {
$scope.Schedules = data;
if ($scope.Schedules.length > 0) {
}
})
.error(function () {
$scope.error = "An Error has occurred while loading posts!";
});
}
$scope.searchScheduleDetails = function () {
selectScheduleDetails($scope.projectId);
}
});
MVC HTML Page: All the final result, I will be displaying in the HTML page. Since here, we receive all the result as dynamic, we cannot predefine any value in our HTML page. The HTML table header and data needs to be generated dynamically.
Since we need to display the dynamic header and dynamic data, I will be using the nested “ng-repeat” to display the dynamic results. In Header, to avoid the duplicate result, I have limited the result to be displayed as 1 ”limitTo:”
Note: I have used the {{key}} to first display the header result. And I have used the {{val}} to display the result data.
As I have explained to you already, I have used the numbers lie “-1”,0,1,2 in data display, our final result in HTML table as a Graphical project Scheduling Chart.
I have used the Span tag to display the result in graphical way of chart in Table with appropriate colors filled by each status.
<table style=" background-color:#FFFFFF; border: solid 2px #6D7B8D; width: 99%;
table-layout:fixed;" cellpadding="0" cellspacing="0">
<tr style="height: 30px; background-color:#336699 ;
color:#FFFFFF ;border: solid 1px #659EC7;"
ng-repeat="item in Schedules | limitTo:1">
<td width="80" align="center"
ng-repeat="(key, val) in item | limitTo:1">
<table>
<tr>
<td >
{{key}}
</td>
</tr>
</table>
</td>
</tr>
<tr style="height: 30px; color:darkred ;border: solid 1px #659EC7;"
ng-repeat="item in Schedules" >
<td width="80" style="border: solid 1px #659EC7;
table-layout:fixed;padding:0;" align="center"
ng-repeat="(key, val) in item" >
<table cellpadding="0" cellspacing="0">
<tr>
<td align="center" width="60"
style="padding:0;">
<div ng-if="key == 'ProjectName' ">
{{val}}
</div>
<div ng-if="key == 'viewtype' ">
{{val}}
</div>
<div ng-if="key == 'ProjectType' " >
{{val}}
</div>
<div ng-if="val == '0' &&
key != 'ProjectType' " >
</div>
<div ng-if="val == '1' && key != 'ProjectType'" >
<span style="background-color: deepskyblue;
width: 100%; float:left;
display: inline;margin-right:76px;" > </span>
</div> <div ng-if="val == '2' &&
key != 'ProjectType'">
<span style="background-color: limegreen; width: 100%; float:left;
display: inline;margin-right:76px;"> </span>
</div>
<div ng-if="val == '-1' && key != 'ProjectType'">
<span style="background-color: red; width: 100%; float:left;
display: inline;margin-right:48px;color:white">END</span>
</div>
</td> </tr> </table>
</td>
</tr>
</table>
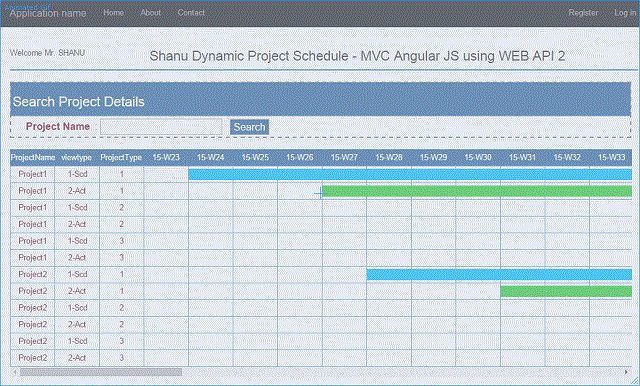
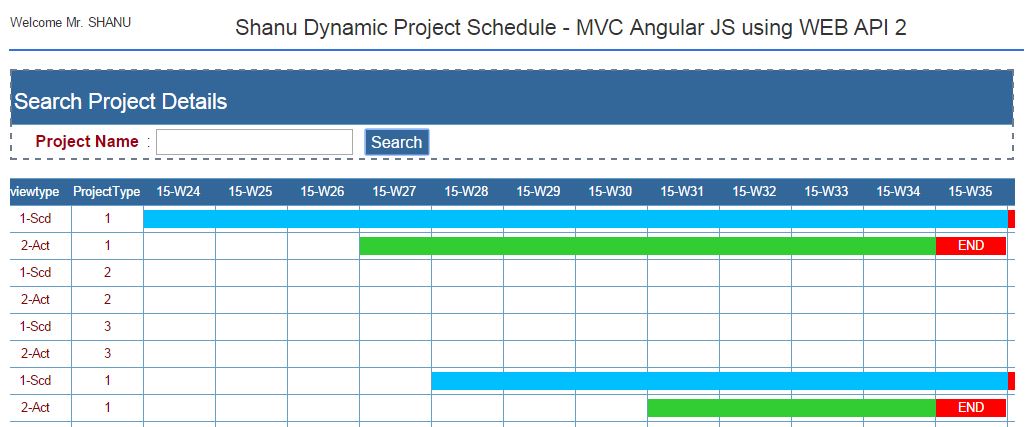
Final Output: The final output will be like this. As I already mentioned, all the final result will be got from stored procedure using the data Status like “-1,0,1,2” I will display the span tag inside HTML table to display or Project Schedule Chart.
We display Schedule and Actual result inside the HTML table as below.
Here, we can see for each project, I will display the Schedule chart as blue color with Schedule End date as red color and similarly for each project Actual start date I will display with green color and End Date with red color.
In my Stored procedure, I will check for each Schedule and Actual Start and End date range and I will display the result in Week Order with range to display as the status as 1 for Schedule and 2 for Actual.
For example, let's take for result below we can see project1, 1-Scd in our table, we insert the:
Schedule Start Date - 2015-06-01 (if we check for the Week no of this Date, it will be as Week 24)Schedule End Date - 2015-09-02 (if we check for the Week no of this Date, it will be as Week 36)Actual Start Date - 2015-06-22 (if we check for the Week no of this Date, it will be as Week 27)Actual End Date - 2015-08-26 (if we check for the Week no of this Date, it will be as Week 35)
We can see in my Stored procedure result for the Start and End date range for each week, I will display the result as 1 for Schedule and 2 for Actual. In my MVC HTML page using the AngularJS ng-repeat and ng-if="val == '1', I will check for each result and display the Chart inside Table like below:

Points of Interest
Note: In WebConfig file, you can find “shanuConnectionString” change the connection string as per your SQL Server connection.
Supported Browsers: Chrome and Firefox
History
- 3rd August, 2015: Initial version
