Introduction
There are many commercial and free chart implementations. One of the less frequently encountered chart types is a radar chart, sometimes also called a web chart. This type of chart can be used for presenting data but it also works great as user control for entering various types of variables (example: https://multi-sense.renault.pl/megane/pl_PL/).
This article describes a radar chart which is part of the open source Manufaktura.Controls library (http://musicengravingcontrols.com/). This library is known especially for its music notation components (described in this article: https://www.codeproject.com/Articles/1252423/Music-Notation-in-NET) but also contains tools and controls useful in other areas.
Like everything in the library, the radar chart is written in a cross-platform fashion. The implementation is similar to score renderers (described here: https://www.codeproject.com/Articles/1252423/Music-Notation-in-NET) – base classes handle most of the calculations to properly position chart elements like axes, sample points, etc. Then classes for specific platforms handle the drawing at previously calculated coordinates.
This example contains a fully usable WPF control and a simple proof-of-concept implementation for ASP.NET MVC (as Razor extension).
Architecture
Base Classes and WPF Implementation
The base class, RadarChartRenderer, contains a single public method RedrawChart which is used to draw a chart for a given set of samples. It also contains the following abstract methods:
ClearCanvas – clears a canvasDrawAxisLabel - draws axis label at given coordinatesDrawAxisLine – draws axis line at given coordinatesDrawPolygon – draws a polygon at given coordinatesDrawSample – draws a sample point (usually represented by a circle) at given coordinatesDrawTick – called only when number of axes is less than three. Draws tick linesDrawWebLine – called only when number of axes is three or more – draws lines between ticks
RadarChartRenderer handles all the calculations needed to property position elements on canvas surface. It then calls abstract methods which have implementations for specific platforms. It also requires two generic arguments:
TControl – a type that represents a chart control or an object containing chart settingsTCanvas – a canvas object on which rendering will be performed. It can be any object, like control, XML element, StringBuilder, etc.
Let’s look at WPFRadarChart renderer. It draws chart on a Canvas element which is a part of RadarChart control. It also contains implementations of RadarChartRenderer’s abstract classes. This is an example of drawing axis lines:
protected override void DrawAxisLine(Primitives.Point start, Primitives.Point end)
{
    var line = new Line();
    line.SetBinding(Shape.StrokeProperty,
        new Binding(nameof(RadialChart.AxisStroke)) { Source = Control });
    line.SetBinding(Shape.StrokeThicknessProperty,
        new Binding(nameof(RadialChart.AxisStrokeThickness)) { Source = Control });
    line.X1 = start.X;
    line.Y1 = start.Y;
    line.X2 = end.X;
    line.Y2 = end.Y;
    Canvas.Children.Add(line);
}
As we can see, a Line object is created and added to canvas. This example uses the mechanism of databinding to bind line parameters (such as thickness) to control properties.

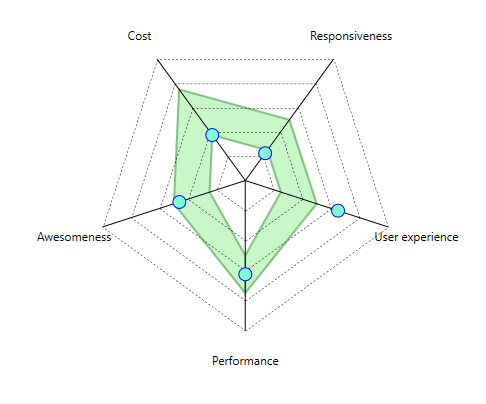
Thanks to the implementation based on data bindings, the chart is fully interactive. The user can drag samples on the chart and the change of value is immediately reflected in the model which is a collection of RadarChartSamples, bound to Samples property of RadarChart control.
RadarChartSample class has the following properties:
AxisDisplayName, AxisShortName - short and full name of axisValue - sample valueValidationMinValue, ValidationMaxValue - boundaries that define a range of valid values which is displayed on the above example as a green polygonValidationCompartments - work like ValidationMinValue and ValidationMaxValue but allows a programmer to specify many ranges of valid values on the same axis (i.e., 3-10, 15-20, etc.),Scale - useful property if you want to create a chart that presents values with different orders of magnitude on different axes. Example: MaxValue property of the chart has a value of 100 and on one axis you have a variable which takes values from 0 to 100. The other axis presents a variable that has values from 0 to 10. You might want to set a Scale of 10 for the other axis to create a better user experience (the user will have the entire axis available for dragging sample points).
Razor Implementation
The architecture of this project allows the programmer to quickly implement radar chart on the other platforms using a single codebase. I created an HtmlSvgRadarChartRenderer class as a proof of concept for this architecture. This class renders charts as HTML SVG element:
HtmlSvgRadarChartRenderer : RadarChartRenderer<HtmlRadarChartRendererSettings, XElement>
I implemented only most important methods, like DrawAxisLine:
protected override void DrawAxisLine(Point start, Point end)
{
    var element = new XElement("line",
    new XAttribute("x1", start.X.ToStringInvariant()),
    new XAttribute("y1", start.Y.ToStringInvariant()),
    new XAttribute("x2", end.X.ToStringInvariant()),
    new XAttribute("y2", end.Y.ToStringInvariant()),
    new XAttribute("style", Control.AxisLinePen.ToCss()));
    Canvas.Add(element);
}
We also have to write Razor extesions to use the chart in views:
[SuppressMessage("Microsoft.Design", "CA1006:DoNotNestGenericTypesInMemberSignatures",
Justification = "This is an appropriate nesting of generic types")]
public static MvcHtmlString RadialChartFor<TModel>(this HtmlHelper<TModel> htmlHelper,
Expression<Func<TModel, RadarChartSample[]>> expression, HtmlRadarChartRendererSettings settings)
{
    if (expression == null) throw new ArgumentNullException(nameof(expression));
    if (settings == null) throw new ArgumentNullException(nameof(settings));

    ModelMetadata metadata = ModelMetadata.FromLambdaExpression(expression, htmlHelper.ViewData);
    RadarChartSample[] samples = metadata.Model == null ? null : metadata.Model as RadarChartSample[];
    return RadialChartHelper(htmlHelper, samples, settings);
}

private static MvcHtmlString RadialChartHelper
(HtmlHelper helper, RadarChartSample[] samples, HtmlRadarChartRendererSettings settings)
{
    var xElement = new XElement("svg");
    xElement.Add(new XAttribute("style",
    $"width:{settings.Width.ToStringInvariant()}px; height:{settings.Height.ToStringInvariant()}px;"));
    new HtmlSvgRadarChartRenderer(settings, xElement).RedrawChart(samples);
    return MvcHtmlString.Create(xElement.ToString());
}
Now we can add the control to the view:
<div>
    @Html.RadialChartFor(x => x.Samples, Model.RadialChartSettings)
</div>
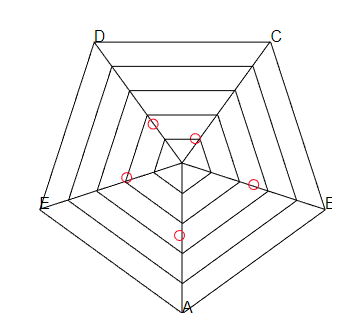
Without excessive styling, the effect looks like this:

The programmer now only has to properly style the control and optionally handle the user interaction logic.
