Introduction
Information for memory leaks provided by the CRT debug library is not very useful. There is only a raw memory snapshot shown. It would be better if developers could see the objects dump in a more convenient form, e.g., class variables. Here is the solution. It's only applied to C++ classes.
Background
Let's take a look at the memory leaks dump information provided by the standard CRT debug library:
Detected memory leaks!
Dumping objects ->
e:\net projects\leaksdumperdemo\leaksdumperdemo\common.h(19) :
    {102} normal block at 0x00359F30, 4 bytes long. Data: <  A > EC 9A 41 00
Object dump complete.
Here, we can see that the dump is represented as a series of bytes and it is not clear what is the current state of the object. It could be very useful for developers to see not raw data but the exact values of the object(class) variables. How could it be done? Very simple. The CRT debug library allows you to specify user defined functions which will dump client blocks. The function prototype is:
void DumpClientFunction(void *pUserData, size_t blockSize);
Where:
pUserData - pointer to the user blockblockSize - size of the user block
To install a user-defined function to dump _CLIENT_BLOCK type memory blocks (debug version only), we need to call...
_CrtSetDumpClient(DumpClientFunction);
...somewhere in our code. But how does one add dump capabilities to the user defined types? The idea is to derive your class from a base class with one virtual function dump_object_info():
class MemoryLeaksDumpBase
{
public:
    virtual void dump_object_info()=0;
};
And then override this function and dump all you need there. You may ask why it is a pure virtual, just to let compiler to warn you if you forget to override it in the derived class.
Using the Code
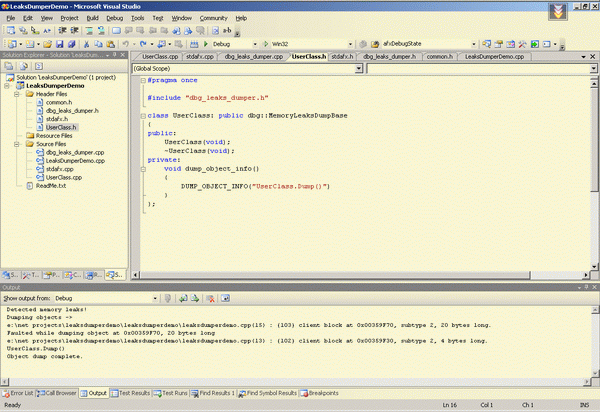
Now let's take a look at how to use the code in your applications. First of all, you should include two files dbg_leaks_dumper.h and dbg_leaks_dumper.cpp to your project. Then derive your class from MemoryLeaksDumpBase, override the dump_object_info() function and dump whatever you want. See the example of user defined type with dump capabilities below:
#include "dbg_leaks_dumper.h"

class UserClass: public dbg::MemoryLeaksDumpBase
{
private:
    void dump_object_info()
    {
        DUMP_OBJECT_INFO("UserClass.Dump()")
    }
};
Add to the your main module such an initialization code:
INIT_MEMORY_LEAKS_DUMPER(_DUMP_ALL_BLOCKS);
Then use user defined new operator (in my example it is _NEW, defined in common.h) for memory allocations for all user defined types. And that's all! Here is the main module from my example project:
#include "stdafx.h"
#include "UserClass.h"
#include "dbg_leaks_dumper.h"
INIT_MEMORY_LEAKS_DUMPER(_DUMP_ALL_BLOCKS);
int _tmain(int argc, _TCHAR* argv[])
{
UserClass* p = _NEW UserClass();
return 0;
}
Now memory leaks information looks more convenient:
Detected memory leaks!
Dumping objects ->
e:\net projects\leaksdumperdemo\leaksdumperdemo\leaksdumperdemo.cpp(13) :
    {102} client block at 0x00359F30, subtype 2, 4 bytes long.
UserClass.Dump()
Object dump complete.
License
This article has no explicit license attached to it, but may contain usage terms in the article text or the download files themselves. If in doubt, please contact the author via the discussion board below.
A list of licenses authors might use can be found here.
