Introduction
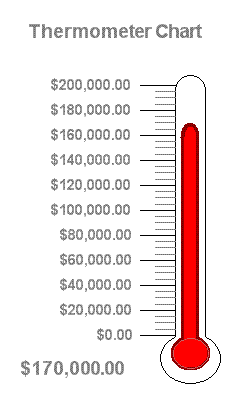
jThermometer is a class for creating thermometer charts of the type used generally to show progress towards a fund raising goal. It arose out of my involvement in a charity walkathon. The organizer wanted to have a thermometer-type chart on a the walkathon's home page to indicate progress towards fund raising goals. I was unable to find anything free that seemed appropriate for the site, so I decided to create my own and share it here on CodeProject.
The chart uses GDI+ to compose an image and stream it out to the browser.
Using the code
For the purposes of portability, I've separated the chart into two parts:
jThermometer is a class that creates a bitmap using GDI+ and streams it out to the current request as a GIF image.- Thermometer.aspx is a web page that accepts various parameters controlling the appearance of the Thermometer chart and that can be referenced by an
<IMG> tag on another web page.
Thermometer.aspx uses these query string values:
MIN: | Value displayed at the bottom of the thermometer. |
MAX: | Value displayed at the top of the thermometer |
IV: | Value indicated on the thermometer. |
T: | Title displayed at the top of the thermometer |
VT: | Type of value (1=currency, 2=decimal, 3=integer) |
Further work
At present, the thermometer does not scale. I'd like to have it automatically scale based on user-provided dimensions. There are also a lot of appearance-related aspects that should be controllable via properties, such as text color, indicator color, and the color of the mercury.
