Introduction
Microsoft SQL Server Profiler is a helper for developers which is a client tool that comes with SQL Server. MS SQL Server Express edition does not come with SQL Profiler bundled. We use this tool to trace through queries. I mostly use this for peer testing as well as when the customer reports some bugs. Well, if you are a 'standard' SQL coder, you won't need to use these tools. May be you have already seen my article on SQL good practices.
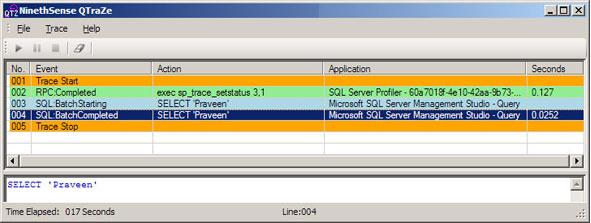
This article is an introduction to the implementation of a 'profiler like thing' with .NET. I would like to call it 'SQL Tracer' since it is out of the scope of this page to develop all the functionalities of a SQL Profiler. I have chosen C# for the demonstration.
Background
I was very much satisfied with the SQL Profiler which is available with Microsoft SQL Server 2000. But the one that comes with SQL Server 2005 seems a little bit slow. It inspired me to develop a fast query tracer tool.
Important
You must have Microsoft SQL Profiler components installed in your machine. You may be asking why we need this new tool if we already have the MS SQL Profiler. Note that the one I explain here is not an alternative for MS SQL Profiler. This is a handy tool with very basic functionalities. As a result, this tool gives you fast results. More than that, this article is for educational purposes.
Using the code
First... Add Reference to Microsoft.SqlServer.ConnectionInfo.
From this, we will get two namespaces:
using Microsoft.SqlServer.Management.Trace;
using Microsoft.SqlServer.Management.Common;
For this example, I would recommend a ListView control since it gives the look and feel of the real Microsoft SQL Server Profiler.
TraceServer
The TraceServer class acts as a representation of a new SQL Server Trace. More information is available here.
Trace file - Trace Definition File - .tdf
You need to create a .tdf file, which is a template file. You can either create a new .tdf by using Save as option from the SQL Server Profiler itself, or you can use the default ones available on your installation folder, which is usually - E:\Program Files\Microsoft SQL Server\90\Tools\Profiler\Templates\Microsoft SQL Server\80\*.tdf.
ConnectionInfoBase
With this class, we will initialize the server host, username, etc. It usually looks like this:
ConnectionInfoBase conninfo = new SqlConnectionInfo();
((SqlConnectionInfo)conninfo).ServerName = "MyComputerNameOrIP";
((SqlConnectionInfo)conninfo).UserName = "PraveenIsMyUsername";
((SqlConnectionInfo)conninfo).Password = "MyPassword";
((SqlConnectionInfo)conninfo).UseIntegratedSecurity = false;
More information about this class is available here.
InitializeAsReader
This method is used to initialize an object for reading from the trace log file or server. E.g.:
TraceServer trace = new TraceServer();
trace.InitializeAsReader(conninfo, "mytracetemplate.tdf");
InitializeAsReader causes the initialization and starting of the tracing operation.
Reading trace information
trace.Read() is used to read trace information from SQL Server. You can put a loop to fetch all the trace information. Like this:
while (trace.Read()) {
}
Inside this loop, you can display status information in a ListView. The trace object contains all the needed properties.
trace["EventClass"] contains information like ExistingConnection, Audit Login, Audit Logout, RPC:Completed, Trace Start etc. If you are a SQL Profiler user, then you are already familiar with these messages.
trace["TextData"] is the element which contains the queries which are being executed.
Like this, we have trace["ApplicationName"], trace["Duration"] etc. also available. These elements are defined in your .tdf file. So investigate it. trace.FieldCount will give you the number of fields available. Since this article is for intermediate users and you know about fetching the values from collections etc., I will not mention it here.
Use threading
Since trace.Read() will not give you control to do your other tasks, there is a chance you will feel like your application died. So, use Thread.
Start, Pause, and Stop
You can control the tracing by applying the trace.start(), trace.pause(), and trace.stop() methods.
Do not forget to use trace.close() after use. Standard practice anyway.
Need a sample application?
Unfortunately, I do not have a stable sample application to provide. I will upload it once I get one.
