Introduction
No matter how well you design your system, a distributed SOA application is always complex. When a SOA application fails, it can be difficult to track down not only the cause of the problem but also the component and web service where the error occurred. Logs from the same error are likely to be positioned on different machines, collocated with the web service and the consumer participating in the activity. When finding the cause of the problem, it is necessary to piece together logs from different machines. It is difficult to figure out how the web service was consumed, when the error occurred. Also, there is no easy mechanism to capture the flow of activities end-to-end within the system, as they occur.
To handle this difficulty, you need a reliable logging system which could be UptoLog. In this article, I will look into UptoLog and describe how this log system is used in an .NET SOA application.
Using UptoLog
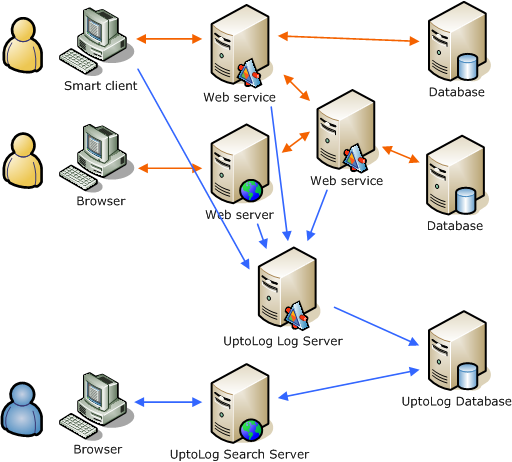
UptoLog is designed to gather detailed information about application failures in .NET 2.0, 3,0 and 3.5 applications. The system logs errors and generates trace and time measurements across multiple logical and physical layers. Log data is gathered in one central database. All log data gathered during a specific activity are related through a unique activity ID. This makes it possible to group errors, traces and time measurements for a specific activity across many layers from end-to-end within the system.
The figure shows how the UptoLog logging system is integrated into a SOA application.

You can find detailed information about the different components in the UptoLog logging system here.
UptoLog Search Server is a web application with a straightforward search tool. This enables you to search the gathered log data and survey an application failure, or observe the actual response time of the system through time measurements across multiple machines.
For example if an application error occurs, the web service consumer and context is automatically visualized, because the error logs are gathered in one central database from all layers in the application and the logs are grouped per activity.
Here are two examples of how logs are visualized through UptoLog Search Server.
Screen shot from an application failure showing two error logs, from two different layers, grouped per activity:

Screen shot showing time measurements from an activity, which in correlation shows the response time of the SOA application:

If you would like to try these examples, the test application used in the examples can be downloaded here. The test application is located in a .NET 2.0 solution that also contains other examples.
Logging with UptoLog
An application logs through the UptoLog Satellite component, which is integrated into all the consumer and web service applications in the SOA application.
In the following, the logging functionality is shortly described. A more detailed description can be found here.
An error is logged by a method call. UptoLog logs errors in three different error levels. Depending on the wanted error level, one of the following methods is used: LogFatalError, LogError, or LogWarning.
This shows how a fatal error is logged:
try
{
}
catch (Exception exc)
{
Log.LogFatalError(exc);
}
Traces are collected by UptoLog Satellite which sends the trace loggings in packages.
This shows how a trace is generated:
private void SomeMethod()
{
Log.LogTraceItem("Trace text before the code is executed");
Log.LogTraceItem("Trace text after the code is executed");
}
UptoLog Satellite collects the time measurements and sends the measurements in packages. The time measurements can generally be generated in two different ways.
This shows how time measurements are generated:
private void SomeMethod()
{
TimeMeasure tm = Log.BeginTimeMeasure("Name of the time measurement");
tm.EndTimeMeasure();
}
private void SomeMethod()
{
using (Log.BeginTimeMeasure("Name of the time measurement"))
{
}
}
Activities in UptoLog
UptoLog Satellite holds an activity guid in the consumer which must be renewed every time a new activity is begun. When a web service is called by a consumer, the web service request is part of an activity which is started outside the web service. It is therefore necessary to read the activity guid (activity ID) in UptoLog Satellite at the consumer, send the activity guid with the web service call and hand it to UptoLog Satellite in the web service.
The activity guid is renewed like this:
Log.StartNewActivityId();
The activity guid can subsequently be read in UptoLog Satellite at the consumer like this:
Guid someActivityId = Log.CurrentActivityId;
The activity guid received by the web service call is handed to UptoLog Satellite in the web service like this:
Log.CurrentActivityId = someActivityId;
General Information
UptoLog 2008 is released and the trial edition can be tried out for free for 30 days. You can download UptoLog Trial Edition here.
You can find more information about UptoLog at www.UptoLog.com.
