This article is not about understanding the details of .NET WCF service, soapUI and Fiddler as all these three are quite popular things among .NET developers. And tools like soapUI and Fiddler may already be in the arsenal of many web developers and QA engineers. Those who are new to these two tools should refer to following articles:
However, we will take a look into how Fiddler can be used to Monitor SOAP Request and SOAP Response transmitting behind the soapUI.
Let’s start with a simple WCF service in place. No need to have a WCF .NET Client as of now to test and monitor HTTP traffic of WCF service calls.
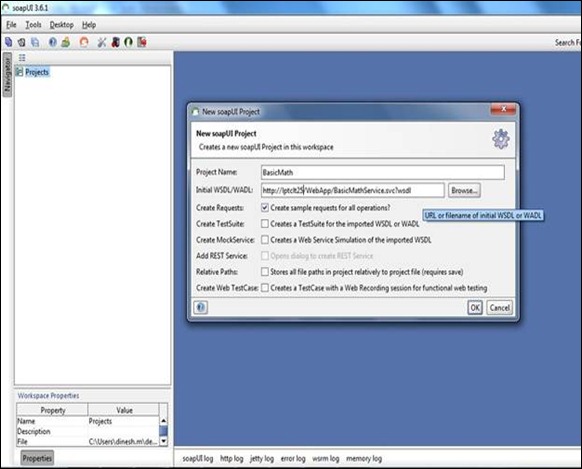
- Open soapUI and set the following settings. Make sure the service’s wsdl path is correct.
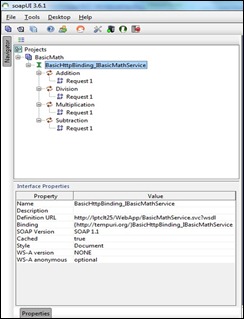
- After loading the definition of WSDL, service definitions will appear like shown below:
- Double click on Request # node and navigate to the request window on the right.
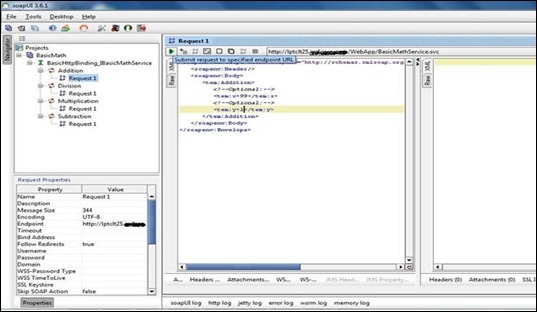
- Fill the method parameters denoted by “?”.
- Open Fiddler and make sure it is ready to capture HTTP(S) traffic.
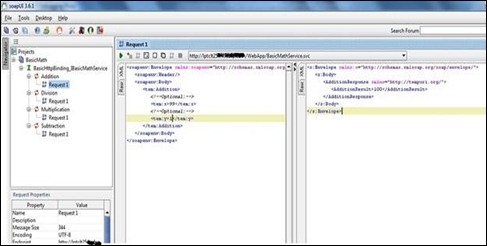
- Submit request to the specified endpoint and SOAP Response can be seen on the right pane.
- If you see the Fiddler window, there is no traffic captured. This is really frustrating if you have been testing your services using soapUI when you do not see the underlying details of the SOAP Request and SOAP Response in the wire.
- All you need to do following proxy settings in the soapUI File –> Preferences –> Proxy Settings window.
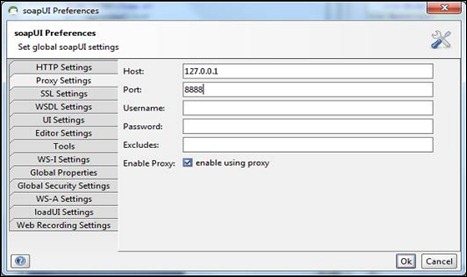
- Re-submit web service request on soapUI.
- Now you see WCF Request-Response traffic in the Fiddler window
 . You are now all in your territory to view the details of service request-response headers, body, and many more!

But why did we add Port No. 8888 in the proxy settings of soapUI? It is because Fiddler by default listens on port no. 8888.

If you have configured your Fiddler proxy tool to listen on some other port number, then you should use that one.
I hope you enjoyed this testing tip. No need to reiterate how blissful it is to test web services using soapUI and Fiddler if you are a web service developer/provider to remote clients.
CodeProject
Filed under:
.Net Technologies,
ASP.Net,
CodeProject,
Dot Net Tips,
Dot Net Tools,
WCF Tagged:
Debugging,
Fiddler,
soapUI,
WCF,
Web Service 


