Introduction
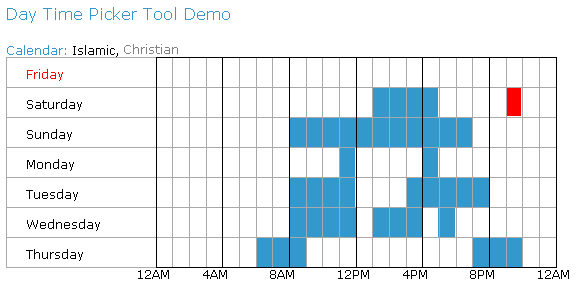
This is a web implementation for the WinForms Time-Of-Day Picker Control written previously here on CodeProject. This implementation allows the user to select different time periods during the day, straight from the web application.
Background
In order to implement the time period picker, I needed to find a client scripting library that allowed me to draw lines and highlight rectangles on the web browser. After Googling around a bit, I found this drawing library which enabled me to draw the initial static calendar.
Drawing the calendar was 50% of the work, the other 50% was to allow the user to highlight calendar cells on the mouse-down event, and stop highlighting them on the mouse-up event within a selection box, similar to the selection box of any graphics application like the Paint.
Using the code
The basic idea is to define a div area where the drawing will take place, then hook up the mouse events within that area to the appropriate drawing functions. In my ASPX file, I defined an area with an id="MyCanvas" as follows:
<div id="myCanvas" style="position:relative;height:230px;width:550px;"
    onmousedown="StartSelection(event, this)"
    onmousemove="HighlightCell(event, this)"
    onmouseup="EndSelection(event, this)"
    onmouseout="MouseExited(event, this)"></div>
In the above div, I hooked up the mouse-down event to StartSelection, the mouse-move to HighlightCell, the mouse-up to EndSelection, and finally, the mouse-out to MouseExited.
The StartSelection flags the initiation of cell highlight, which is then checked by HighlightCell to determine if the cell under the mouse should be highlighted as part of an ongoing selection or not. EndSelection simply turns off the selection flag so that subsequent calls to HiglightCell coming from the mouse-move event will not cause cell selection.
Finally, OnMouseExited is necessary to end the selection when the mouse simply exits the canvas area.
Points of interest
Initially, some global variables need to be defined:
var jg = new jsGraphics("myCanvas");
var xTextCellOffset=20;
var yTextCellOffset=10;
var daysCellWidth=150;
var daysCellHeight=30;
var timeChartGridWidth=400;
var timeChartGridHeight=daysCellHeight*7;
var cellWidth=timeChartGridWidth/24;
var cellHeight=daysCellHeight;
var selectedCells=new Array();
In addition to the above drawing mechanism, some static functions are provided to draw the initial calendar. I've written some basic drawing routines that are built on top of the wz_jsgraphics drawing library mentioned above:
DrawGrid:
This function allows you to draw a grid starting at point (x, y) in pixels, with a certain width and height, while specifying the number of rows and columns:
function DrawGrid(x, y, width, height, numberOfRows, numberOfColumns)
{
    for(row=0; row<=numberOfRows; row++)
    {
        var rowInPixles=y+row*height/numberOfRows;
        jg.drawLine(x, rowInPixles, x+width, rowInPixles);
    }

    for(col=0; col<=numberOfColumns; col++)
    {
        var colInPixles=x+col*width/numberOfColumns;
        jg.drawLine(colInPixles, y, colInPixles, y+height);
    }

}
DrawCalendar:
The function DrawCalendar takes a type of calendar (Islamic or Christian) and draws the days axis, the day time axis (with Friday being the first day for the Islamic calendar, and Sunday being the first day for the Christian calendar), and the hourly grid which is divided into 24 hours:
function DrawCalendar(type)
{
selectedCells=new Array();
if(type==1)
{
document.getElementById( "Islamic" ).style.color="Black";
document.getElementById( "Christian" ).style.color="Gray";
}
else if(type==2)
{
document.getElementById( "Islamic" ).style.color="Gray";
document.getElementById( "Christian" ).style.color="Black";
}
jg.clear();
DrawDaysAxies(type);
DrawTimeAxis();
DrawTimeChartGrid();
jg.paint();
}
And that's all there is to it!
