Introduction
In this article, I will show a way to implement a tab structure in a SSRS report; as reporting services doesn't provide a lot of controls to design our reports so we need to use the existing controls to achieve our targets. To create a tab control in a report, I will use simple textbox and table control and visibility property of table control.
Background
I recently came across a post in ASP.NET forums asking about creating a report containing a tab control (How to create Excel like tab layout?). I faced a similar situation a few months back when our client strictly wanted to display only one table at a time in a report. I spent a lot of time to find out a way to achieve this, but had no luck and finally I came up with this approach. I must admit that I was not at all happy implementing such (ugly) tab structure, but the client was ok with this, so I did.
Requirement
So the requirement is that we have three tables which need to be displayed in a report and every table must be associated with a tab and at any given time, only one table will be visible in the report. User can select any of the given tabs and the corresponding table will become visible and the other will be hidden.
Challenges
Following are the problems in implementing a tab structure in reports:
- There is no tab control in reports.
- We don't have any way to capture events in reports, so we can't show/hide tables based on users' action.
- Even if we somehow implement this, we are not sure whether we will have the same output while we export the report in Excel, PDF and other formats.
Solution
Due to the limitations of report designer, we can't fulfill all the requirements so we will implement a tab structure with the following behavior:
We will have three tabs as required, but each tab will have a +/- sign, clicking on which will show/hide the tab data. This +/- sign is due to the use of Visibility can be toggled by another report item property of table control.
At the start, only one table will be visible and the user can click on any other tab (+/- sign). Clicking on tab (+/-) will show/hide the corresponding table. So if all three tabs are in expanded state (i.e. in - state), then all three tables will be visible and if all three tabs are in collapsed state (i.e. in + state), then all three tables will be hidden, tables can be in mixed state too based on tab states.
Implementation
Let's start with the implementation:
- Create a new report and add three text boxes and three tables to it, add table headers, create datasets and attach them to tables, etc.
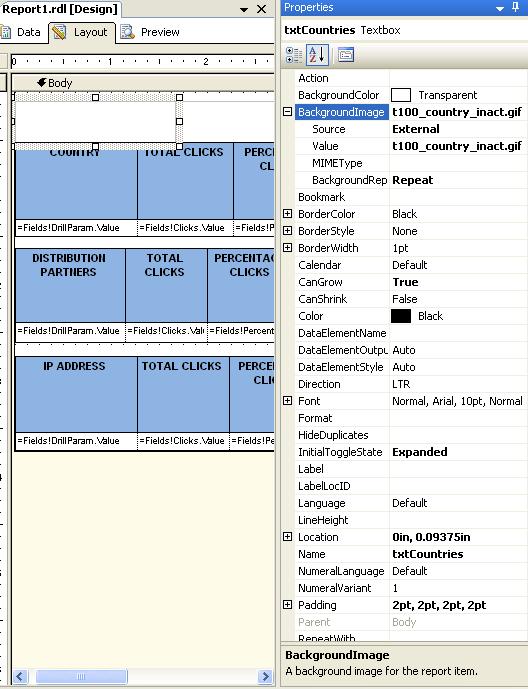
- Get three images for the tabs, and set them as BackgoundImage of respective textbox. Also set their InitialToggleState to Expanded.

- Select first table, right click -> properties -> Visibility and check the Visibility can be toggled by another report item check box and select the corresponding textbox (tab) name from the Report item dropdown. This will attach the visibility of this table with this text box and a +/- sign will be displayed on that text box for toggling.

- Repeat the above step for the other two tables and also set their Initial visibility to Hidden.
That's it, preview the report and the outcome will be something like this:

A sample report is attached with the article for reference.
Known Issues
Although this tab structure was good enough for display, it has a few issues while exporting.
- Exported reports are not the same in PDF and Excel. In PDF, you will see tabs (textboxes) whereas in Excel, you won't.
- In PDF, only visible tables will come (The PDF document is rendered to match the current state of any items in the report), whereas in Excel all tables will be displayed irrespective of their visibility state.
History
- 24th June, 2008: Initial post
