Introduction
Windows Task Manager has a nice performance meter control to show the current and historical data about CPU and memory usages. This kind of control is useful in many monitoring applications, such as the one used in our Call Center Software. We use it to meter several key factors, such as number of agents logged in, how many calls are currently active, and how are phone lines and agents are being utilized.
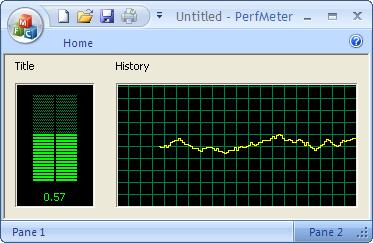
We want something similar to the performance meter in Windows Task Manager. It should have similar look and feel. Especially, the background grid should shift with data so it won't look static.
The result is the code we present here.
Creating the View Class
We use a CView derived class to show the drawing of the performance meter. Since all the drawing code are in the DrawPerf(CDC& dc, CRect rect) class method, you should be able to use the same code if you need to create a control class. For more information about creating a custom control class, please take a look at Chris Maunder's article Creating Custom Controls.
class CPerfMeterView : public CView
{
...
public:
virtual void OnDraw(CDC* pDC);
protected:
void DrawPerf(CDC& dc, CRect rect);
void DrawPerfLeft(CDC& dc, CRect rect, const CString& reading, int r, int total);
void DrawPerfRight(CDC& dc, CRect rect, int total);
void DrawPerfDataLineChart(CDC& dc, CRect rect);
protected:
CFont* m_pFont;
CPen m_penDottedGreen;
CPen m_penSolidGreen;
CPen m_penSolidYellow;
CPen m_penSolidDarkGreen;
int m_leadingTick;
UINT m_perfTimerId;
...
};
To reduce flicker, we use a bitmap DC. Here we simply use the CMemDC class that is included in the MFC feature pack. The include file is "afxcontrolbarutil.h". If you are using older version of the VC++, you can check some of the projects posted here for flicker free drawing.
void CPerfMeterView::OnDraw(CDC* dc)
{
CRect rcClient;
GetClientRect(&rcClient);
CMemDC memDC(*dc, this);
memDC.GetDC().SetBkMode(TRANSPARENT);
if (! m_pFont)
m_pFont = GetHeightFont("Tahoma", 12, memDC.GetDC());
CFont* pOldFont = memDC.GetDC().SelectObject(m_pFont);
DrawPerf(memDC.GetDC(), rcClient);
memDC.GetDC().SelectObject(pOldFont);
}
Draw the Meter
The actual drawing of the performance meter is not difficult. Most of the code involves calculating the CRect for the drawing. The top level drawing code is in DrawPerf, which is invoked from OnDraw function. The background color is the system's COLOR_BTNFACE. This function simply call DrawPerfLeft and DrawPerfRight once it calculates the with for each meter.
void CPerfMeterView::DrawPerf(CDC& dc, CRect rect)
{
CPerfMeterDoc* pDoc = GetDocument();
ASSERT_VALID(pDoc);
if (! pDoc)
return;
if (! dc.IsPrinting())
dc.FillSolidRect(rect, ::GetSysColor(COLOR_BTNFACE));
if (rect.Width() < 100 || rect.Height() < 60)
return;
CString reading;
int r, total;
pDoc->GetMeterReading(reading, r, total);
CRect lrect(rect);
lrect.right = 100;
DrawPerfLeft(dc, lrect, reading, r, total);
CRect rrect(rect);
rrect.left = 101;
if (rrect.Width() < 100)
return;
DrawPerfRight(dc, rrect, total);
}
The left meter contains a title, a metering box with bars showing the maximum of metering value (tota) and current reading r, using a solid green pen or a dotted green pen.
void CPerfMeterView::DrawPerfLeft(CDC& dc, CRect rect, const CString& reading, int r, int total)
{
CPerfMeterDoc* pDoc = GetDocument();
CRect titlerect(rect);
titlerect.left += 10;
titlerect.top += 4;
titlerect.bottom += 16;
dc.DrawText("Title", titlerect, DT_SINGLELINE | DT_TOP | DT_LEFT);
...
...
...
CPen* pOldPen = dc.SelectObject(&m_penDottedGreen);
draw_bars(dc, rect, middle, totalbars - rbars, 1);
dc.SelectObject(&m_penSolidGreen);
draw_bars(dc, rect, middle, rbars, 0);
dc.SelectObject(pOldPen);
}
The right meter is for drawing historical data. It contains a title and a line graph. Here we use a member variable m_leadingTick to keep track of how much to shift the background grid with each drawing. The grid is hardcode to be 12 pixels, and each shift is 1/6 of the grid unit.
void CPerfMeterView::DrawPerfRight(CDC& dc, CRect rect, int total)
{
...
dc.DrawText("History", titlerect, DT_SINGLELINE | DT_TOP | DT_LEFT);
...
CPen* pOldPen = dc.SelectObject(&m_penSolidDarkGreen);
int delta = 12;
for (int i = rect.bottom - delta; i > rect.top; i = i - delta) {
dc.MoveTo(rect.left, i);
dc.LineTo(rect.right, i);
}
for (int i = rect.right - (m_leadingTick * delta/6); i > rect.left; i = i - delta) {
if (i == rect.right)
continue;
dc.MoveTo(i, rect.top);
dc.LineTo(i, rect.bottom);
}
DrawPerfDataLineChart(dc, rect);
dc.SelectObject(pOldPen);
}
Getting Data
The view class calls the document class for current measurement data and historical data. For this sample, the actual data is generated randomly. The view class uses the following three methods.
class CPerfMeterDoc : public CDocument
{
...
void UpdatePerfData();
void GetMeterReading(CString& reading, int& r, int& total);
BOOL GetPerfDataNext(int index, double& r);
...
protected:
CArray<int> m_perfs;
};
The GetMeterReading method is used in drawing the left meter. The GetPerfDataNext method is used to draw historical line graph.
void CPerfMeterView::DrawPerfDataLineChart(CDC& dc, CRect rect)
{
 ...
 while (drawIndex > rect.left) {
  double r;
  if (! pDoc->GetPerfDataNext(dataIndex, r))
   break;
  int v = rect.bottom - int (rect.Height() * r / 100);

  if (lastr < 0)
   dc.MoveTo(drawIndex, v);
  else
   dc.LineTo(drawIndex, v);
  dc.LineTo(drawIndex - dataUnit, v);
  lastr = r;
  drawIndex -= dataUnit;
  dataIndex++;
 }
}
The Timer
The timer is used to refresh the data and meter. The current elapse time for the timer is 1 second. On each timer tick, the m_leadingTick is updated and the graph is invalidated for redraw.
void CPerfMeterView::OnTimer(UINT_PTR nIDEvent)
{
 if (nIDEvent == m_perfTimerId) {
  if (m_leadingTick++ >= 6)
   m_leadingTick = 0;
  CPerfMeterDoc* pDoc = GetDocument();
  if (pDoc)
   pDoc->UpdatePerfData();
  Invalidate();
  return;
 }
 CView::OnTimer(nIDEvent);
}
