Introduction
Many articles have been written about Windows performance counters.
Several paths are available to interact with these counters. The appropriate technology to use depends on several factors like the know-how of the one responsible for the implementation, the platform where the application consuming the counters is running on, the availability of WMI, the type of data to collect, and of course, the type of diagnosis to perform.
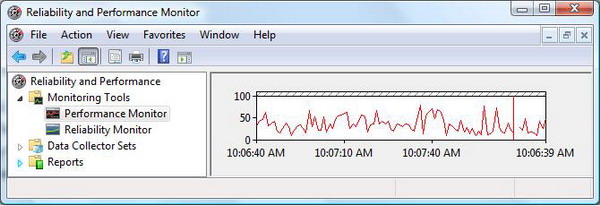
The famous visage of performance counters is the Windows Vista built-in MMC Performance Monitor which is hosted in the “Reliability and Performance Monitor” snap-in. An easy way to view it is to invoke perform.exe from the prompt.
After consenting the UAC dialog when prompted, one sees the well-known tool to gather diagnosis data.

From the programmer’s point of view, different interfaces can be used to interact with these counters:
- The
System.Diagnostics .NET classes - The WMI classes
- The Performance Data Helper (PDH) functions
- The partly undocumented
NtQuerySystemInformation() functions
Goal
Despite the existence of these interfaces, there is apparently no better way (yet) in order to visualize the performance counters in a graphical way (as it is done within the well known Performance Counters snap-in) than to use an old COM-based technology. The .NET Diagnostics classes don’t help when you want to deal with the graphical representation of the counters.

The standard PerformanceCounter item which is available in the Visual Studio 2008 IDE internally uses Corperfmonext.dll. This component only allows the access to the content of the counters.
This article shows how to take advantage of one component Vista uses when representing the performance curves and histograms. By using this technique, you can benefit of a smooth and easy integration of the existing performance counters within your own diagnostic application.

Additionally, for ease of integration, you can benefit from the well-known, very granular selection and filter potential you are used to having when dealing with the MMC snap-in ….
Back to the roots
COM is not dead!
Behind the scenes, the Windows Vista Performance Monitor uses an ActiveX component which is called Sysmon which is implemented in \%system32%\sysmon.ocx.
Sysmon is the API to configure the Microsoft System Monitor ActiveX control. The System Monitor control lets you view real-time and previously logged performance counter data.
Below, Process Explorer is showing the sysmon.ocx instance.

As a matter of fact, two instances of sysmon.ocx are loaded. It is not the first time I have experienced this situation under Windows Vista. Should anyone have a clue about the reason of this duplicate, please propagate this info! Thanks.
The System Monitor control
For those who are familiar with COM, oleview.exe is the tool to document the COM components that are installed on a system. Oleview.exe is part of the tools that are automatically installed when Visual Studio is on the system.

Using oleview.exe, we can even set the permissions on the activation for any COM components.
Version of the System Monitor control
In Windows XP SP3, Sysmon.ocx has the version 3.6.
In Windows Vista SP2 and Windows Server 2008, it has the version 3.7. This version adds new graph types, the ability to select multiple counters, retrieve counter values from a point on the graph, save graphed counter values to a log file, and the option to have a line graph continuously scroll in the graph window instead of wrap-around on itself.

.NET Project to host the Sysmon ActiveX component
Since it is a COM component, symon.ocx can be consumed by any COM-aware application. By default, syscom.ocx is not referenced by the Microsoft Visual 2008 environment. One has to explicitly add a reference to it when consuming it in a project.
Adding a reference to the project

Once referenced, Sysmon is not yet visible in the Toolbox IDE. This must also be done manually.
Adding the item to the Toolbox
Before Sysmon has been added in the Toolbox UI…

Inserting Sysmon into the Toolbox UI…

Selecting the System Monitor control
As previously mentioned, sysmon.ocx has reached version 3.7 in Windows Vista. This can also be seen in the selection dialog

The System Monitor control component is now visible…

Once added to the Toolbox, drag and drop it on the Form. Once done, a private member is added to the project:

As a result, a private instance is contained in the class.
private AxSystemMonitor.AxSystemMonitor sysmon;
In order to use the Sysmon component, please use its namespace…
using SystemMonitor;
This demo project applies a few (hard-coded) settings when loading the form.
private void Form1_Load(object sender, EventArgs e)
{
sysmon.BackColor = System.Drawing.Color.Black;
sysmon.BackColorCtl = System.Drawing.Color.Gray;
sysmon.GridColor = System.Drawing.Color.Gray;
sysmon.ShowToolbar = false;
sysmon.ShowValueBar = false;
sysmon.ShowTimeAxisLabels = false;
sysmon.ShowVerticalGrid = true;
sysmon.ShowHorizontalGrid = true;
sysmon.ShowLegend = false;
sysmon.ChartScroll = true;
ICounterItem item;
sysmon.AddCounter("\\Process(*)\\% Processor Time", out item);
}
You can, of course, add a few controls or interfaces in order to interact with Sysmon. Otherwise, you can build your application with the settings that fits to your diagnosis and use it.
Development environment
The project has been compiled and tested under the following conditions:
- Windows Vista Ultimate 32 bit
- Microsoft Visual Studio 2008 Professional Edition
Links
History
- July 2009, first released.
