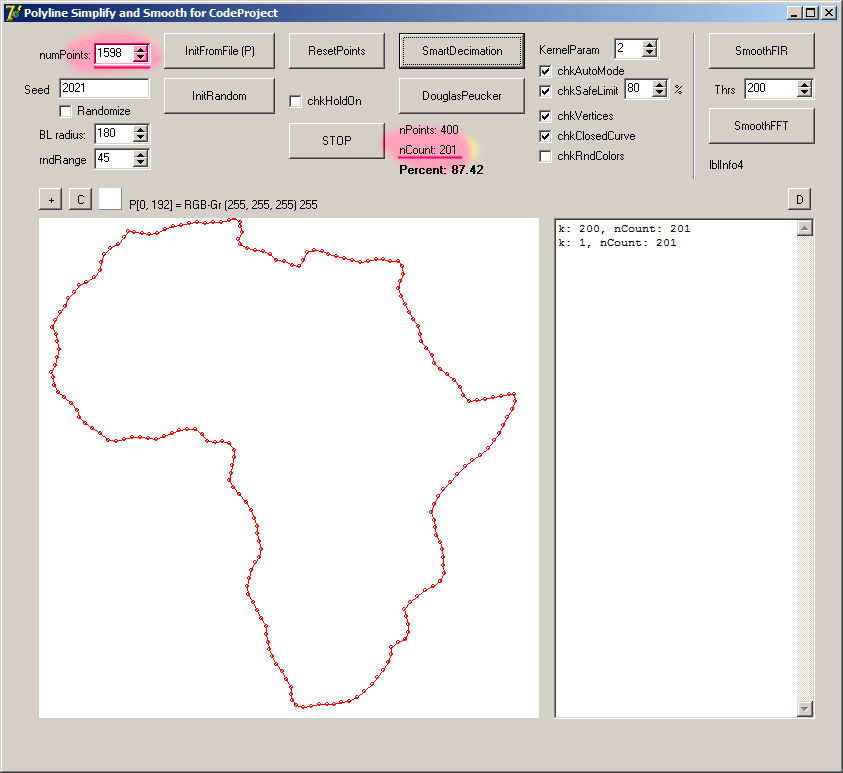
This method is a kind of resampling technique that can be used for upsampling (interpolation) and downsampling (decimation). In this post, I'll demonstrate for only decimation lateral (side?).

Introduction
In this article, I'll present a new method for 2D polyline simplification and also smoothing, I named it Smart Decimation. It's clear that there are well-known methods to get simplified curves by using different methods. For example, in signal processing, multirate resampling using FFT by adding zeros or removing same samples.
As a summary, here are these:
- Douglas-Peucker algorithm
- Visvalingam-Whyatt algorithm
- Curvature-based simplification algorithm
- Maximum Squared Distance algorithm
- Reumann-Witkam algorithm
- Opheim algorithm
- Lang algorithm
- Nth point
- Distance between points
- Perpendicular distance
Before you go on, I recommend that you must first check out this CodeProject article "Polyline Simplification" by Elmar de Koning.
The Method
Suppose we have 3 points and we want to get 5 points (i.e., interpolation). Or, we have 5 points and we want to get 3 points (i.e., decimation). This method can be used for both situations. Here, we use it for reduction.
This method is actually very similar to bilinear interpolation but it is significantly different at all. We know that, in image processing, there are well-known algortihms for image resizing:
- Nearest neighbor i.e., direct copy
- Bilinear interpolation
- Bicubic interpolation
- Sinc/Lanczos interpolation
Visually, the quality of algorithm is better than bilinear but worse than bicubic, for images. When upsizing, it has less or no artifacts (i.e., aliasing, blurring, edge halos) than others.
The best way to explain the underlying logic is to use step by step illustration graphics.

Another Explanation (1D Data)
For example, think that we have 11 values: 41, 79, 9, 36, 11, 33, 23, 46, 36, 88, 89. Now, we want to get only 3 values without losing the main features of data set.

Steps are very simple and easy: Kronicker multiply, then regroup the data and finally calc the average of these data groups.
If we apply these steps, we'll get the result as 41.7273, 25.7273, 66.4545.
NOTE: To be clear, number of input values and number of output values are must pseudo-primes. Otherwise, it only repeats the input values and result will be same as (bi)linear method.
Implementation
Here is the implementation code that adapted for 2D points arrays.
type
TPointArr = array of TPoint;
....
procedure SmartDecimation(source: TPointArr; mSource: integer;
var dest: TPointArr; nDest: integer);
var
m, n, k, p, q: integer;
t1, t2: double;
begin
if ( (mSource < 3) or (nDest < 3) ) then Exit;
t1 := 0;
t2 := 0;
for m:=0 to mSource-1 do
begin
for n:=0 to nDest-1 do
begin
k := m * nDest + n;
t1 := t1 + source[m].X;
t2 := t2 + source[m].Y;
p := k div mSource;
q := k mod mSource;
if (q = mSource-1) then
begin
dest[p].X := trunc(t1 / mSource + 0.5);
dest[p].Y := trunc(t2 / mSource + 0.5);
t1 := 0;
t2 := 0;
end;
end;
end;
end;
Using the Code
The algorithm has been implemented as a procedure SmartDecimation. It takes an input array of points and number of input points (M), and an output array of points and number of output points (N). So, it performs M/N resampling.
Before using the procedure, you have to initialize all parameters.
Examples and Comparison
And, here are some examples and results:
| Original | Smart Decimation
(auto mode) | Smart Decimation
(manual mode) | Douglas-Peucker |
 |  |  |  |
 |  |  |  |
 |  |  |  |
 |  |  |  |
Conclusion and Points of Interest
As we have seen above, this method can be used for both simplification and also smoothing of 2D polylines. I think this feature seems to have an advantage against Douglas-Peucker in some situations.
On the other hand, this method can be used for image resizing, but, this is out of scope for this article. So, I've put only an example/result here:
| Original image | Resized image with SID |
 |  |
References
- Polyline Simplification - CodeProject by Elmar de Koning
- Simplipoly- Curvature-based Polygonal Curve Simplification
- Line Simplification by Mike Bostock
- Efficient dominant point detection based on discrete curve structure
History
- 28th June, 2021: Initial version
