Introduction
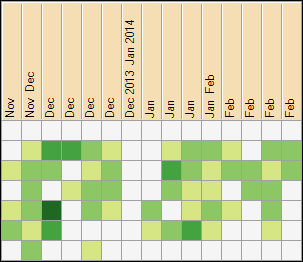
The chart above shows my activity in one of the projects. It looks like Github activity chart but in fact it displays SVN repository activity. Do you want one for your SVN repository? Continue reading, if your answer is yes.
Background
SVN was my first choice for source control and I do not see a reason to change it. But of course, I used Github and I saw their activity charts and I wished to see such charts for my SVN repositories. So I decided to create a tool to visualize a repository activity.
The general structure of the solution is shown in Diagram 1.

Repository Connection
The tool gets a log history from an SVN repository. But there are many source control systems, more or less popular, with different APIs. To retrieve data from others repository types, clients should provide an implementation for IRepositoryConnection interface with a single method IList<RevisionInfo> LoadHistory(RepositoryInfo repo), where RevisionInfo is a class with common revision parameters (Number, Time, Author, Comment, FileCount) and RepositoryInfo is a container for setting needed to connect a repository (Uri or Path to storage, ProjectName, optional MinRevision and MaxRevision)
The only implementation I have by default is SvnRepositoryConnection. It is based on SharpSvn library.
Evaluation Logic
Most calculations are performed in RepositoryHistoryScanner class. Revisions descriptions are grouped by author (PeriodStats) and then by date (DaylyStats). For each author, max commit count and the longest streak are calculated. Authors stats and the best results are stored in PeriodHistory. The general structure is shown in Diagram 2.

When all revisions are grouped and the best stats are known, it's time to measure authors activity and evaluate their activity level on each day. I defined ActivityLevel enum {None, Low, Average, High, Great} for this purpose.
The evaluation is extensible and everyone can suggest an implementation for IDaylyStatsMeasure and IActivityDistribution interfaces.
At the first step, a double (non-negative) value is computed for a DaylyStats object by IDaylyStats Measure.Measure(DaylyStats daylyActivity, PeriodHistory history). At the second step, an activity level is returned by IActivityDistribution.GetLevel(double measure) method. Different measures and distributions can produce quiet different results.
I implemented 2 types of measures:
RevisionsCountMeasure

LeaderRevisionsCountMeasure

Both measures produce values in [0; 1] range.
Also, I added two types of distribution – Uniform and Normal. They are shown in Diagrams 3 and 4.


Visual Client
To visualize authors' activity according to their activity level, written in DaylyStats, I use a DataGridView control. It contains 7 rows – one for each day of the week. Number of columns depends on length of PeriodHistory. Each cell shows authors activity using back color (white if there was not any contributions and gradations of green for higher levels). When a cell is selected, more details are shown in the bottom of the form. In column headers of grid, I draw names of months.
To use the utility, you should only specify repository location (Uri or Path to a working copy folder) and project name in configuration form. RevisionsCountMeasure and UniformActivityDistribution are selected for measurements by default. You can change them in comboboxes. If you can suggest a good implementation of IDaylyStatsMeasure or IActivityDistribution interfaces, post a comment, please. Optional settings are minimal and maximal number of revision. If necessary, input login and password to get access in Authentication form (see screenshots).


Configuration can be saved in file to avoid unnecessary typing next time you use the tool.
Export charts in .png images
If the project lasts for a long period of time, then width of a chart will be greater than screen width. In this case grid chart can be scrolled horizontally, but it will more difficult to make a good screenshot. So I added a function of export of charts in to .png files. You can use this function in Activity Chart form. Click Print Chart button, select file location and save. Image will be saved and opened automatically .
