Introduction
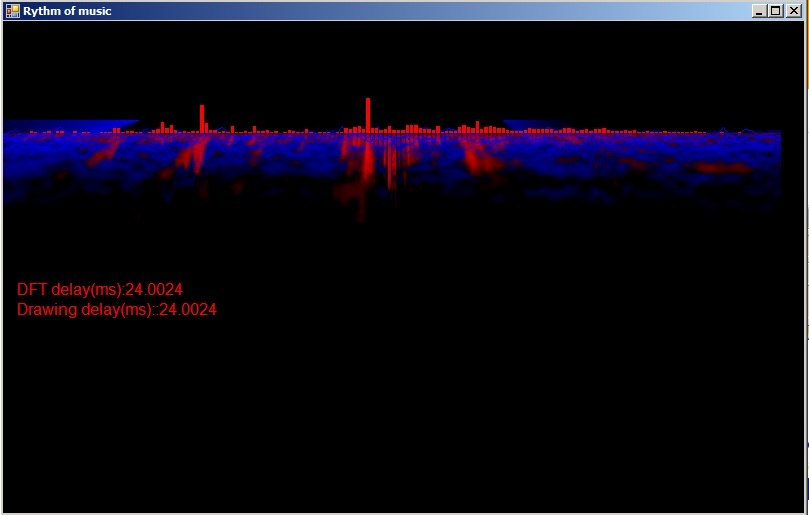
This article is aimed at those who are interested in DSP (Digital Signal Processing - FFT) and graphical visual to be combined in one scene. Anyone in life did listen to the music, but if he wants imaging what would it be? or wants to analyze how much frequency is presented at a moment? How detailed is it?
Now this is a tool/code to answer that!
Video demo: https://www.youtube.com/watch?v=dUoeREaTroU.
Note
The strongest point of this tool is frequency resolution, it's rather fine: up to 11Hz per bin.

Background
- OOP (absolutely)- to build class, etc.
- Winform basic components, basic event handle (paint)
- .NET GDI
- Sound specification (Sample rate, channel, raw data format)
- Using external library
- Math knowledge (Complex number)
- Linked list, a list built and linked via object (consider as pointer to link each other)
- DFT - Discrete Fourier Transform, to transform a wave signal to frequency domain signal. For more details, please see wiki. If you want to know it clearly in code, it is also included in source code (but commented out).
Steps Before Run
Recommended testing song: https://www.youtube.com/watch?v=GXHouoD4KVM
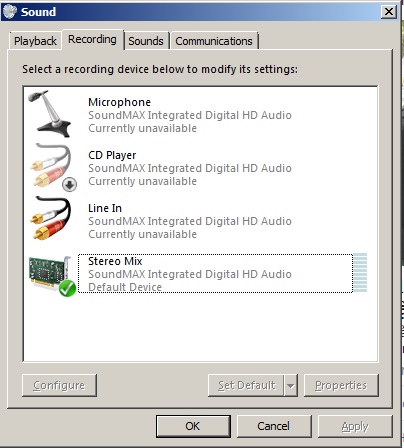
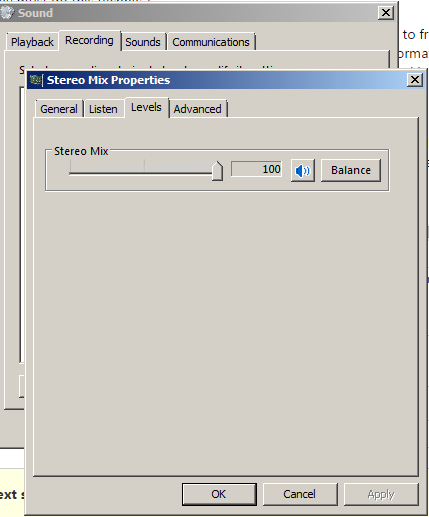
Make sure that your sound card supports Stereo Mix and is configured properly:

You can call this "hardware sensitive", if you're using speaker, I recommend drop it to 50 (or whatever, as long as the spectrum height is fine).

Points of Interest
Overall interest: The visualization is running based on signal capture from the sound card. It means, it doesn't depend on any media file. Not like Window Media or Winamp, you have to open a file. Imagine that you're listening to a song on youtube, in a traditional manner, you try to download it and play by a software just to see the visual effect? Oh NO! That's the stupid manner, now forget that manner, please. Just run the tool and ENJOY!
1. Capture Sound Signal
This is the first job we need to do, by using an external library (NAudio), we can capture the sound signal easily. The recording format is: 44100 samples/s, mono, 10ms per capture event (441 sample). Using the following code:
using NAudio.Wave;
using NAudio;
WaveIn waveInStream;
private void Form1_Load(object sender, EventArgs e)
{
InitSoundCapture();
}
In load form event, temporarily forget some init stuff, just focus on sound capture init. I did wrap sound capture call into a function named InitSoundCapture like this:
private void InitSoundCapture()
{
waveInStream = new WaveIn();
waveInStream.NumberOfBuffers = 2;
waveInStream.BufferMilliseconds = 10;
waveInStream.WaveFormat = new WaveFormat(44100, 1);
waveInStream.DataAvailable += new EventHandler<WaveInEventArgs>(waveInStream_DataAvailable);
waveInStream.StartRecording();
}
private void waveInStream_DataAvailable(object sender, WaveInEventArgs e)
{
if (sourceData == null)
sourceData = new double[e.BytesRecorded / 2];
for (int i = 0; i < e.BytesRecorded; i += 2)
{
short sampleL = (short)((e.Buffer[i + 1] << 8) | e.Buffer[i + 0]);
double sample32 = (sampleL) / 32722d;
sourceData[i / 2] = sample32;
}
AppendData(sourceData);
}
Give it some parameters, the recorded signal will be passed to:
waveInStream_DataAvailable
From there, we will continue to parse to waveform data. The data before parsing is raw PCM data. You should refer to WAV DATA Structure to understand why the code is written like that.
2. Using a Linked List to Contain the Recorded Data
Why must we do this technique?
Here's the explanation: After recording the data, I have to transform it to frequency domain. If I transform only signal that has just been received from capture function, the data length is too short => not enough information to represent. If I increase the capture interval to longer? The data length is good, but in this case, the signal is too discrete, you don't want the visualization to be rendered at 10 fps, right?
=> 2 problems occurred, so now I have a solution to solve them: using LINKED LIST (defined by myself), the application will continuously collect recorded data into a linked/dynamic list. When the signal length is enough for further processing, then it will do the processing. In the meantime, any signal comes into LIST, another segment of signal (oldest signal) will be pop out. Look at the below figure:
Stage 1: Assume the signal is: ABCDEF
Stage 2: The new signal is "GH", let it join to main stream: ABCDEFGH, now it is longer than a threshold (which is predefined before), the oldest signal AB will be cut. Now the stream is: CDEFGH
=> The stream always maintains the long enough length and data is recorded in short interval.
class Node
{
public Node(ComplexNumber value)
{
Value = value;
}
public Node NextNode
{
get;
set;
}
public Node PrevNode
{
get;
set;
}
public bool isEndPoint
{
get;
set;
}
public bool isStartPoint
{
get;
set;
}
public ComplexNumber Value
{
get;
set;
}
}
Small walk over the Complex Number. Why it must be Complex number? Because FFT transform algorithm is stated for the complex number. The formula is a really long and complicated event in complex number. If we try to represent under real number, it could take many pages. And the FFT implementation code is also used for complex number, I have to use complex number for the main value type in this app.
3. Transform Recorded Data to Frequency Domain Data
This is a very complicated process, I just follow the guide and write the code, I still don't understand it 100%, but if you like, here is the link to read: http://www.ti.com/ww/cn/uprogram/share/ppt/c6000/Chapter19.ppt.
4. Compress the Transformed Data
After transforming a long input data, we also got the long output too. Presenting the transformed data on the screen normally is not a good style. The length in this application is 2048. If we use 1 pixel for 1 element, the FULL HD screen is still not enough and the rendered visual is rather hard to observe. You know the spectrum that human hear is not linear, we hear clearly in the low range (40hz -> 1000Hz) but un distinctly in high range ( > 10Khz). So I use the simple SUM calculation differently on different range:
int[] chunk_freq =  { 200, 1000, 2000, 4000, 8000, 16000,22000 };
int[] chunk_freq_jump = { 1, 2, 4, 8, 12,20,100 };
The code means: in < 200Hz, it don't do anything. From 200 to < 1000: Sum 2 signal column into 1 signal column, in 1000 to 2000, sum 4 column and so on..
5. .NET GDI for Amazing Effect
5.1 ColorMatrix and blitter feedback
It is used to transform color of drawn screen and re-drawn screen to make screen-on-screen effect.
Let's figure it out:
First the "A" letter draw onto screen, then all screen backed up to a temp buffer. Next time the backed up buffer is re-drawn onto screen, another letter "B" is drawn to screen. All screen backed up again and so on, new screen overlays old screen continuously.
ColorMatrix colormatrix = new ColorMatrix(new float[][]
{
new float[]{1, 0, 0, 0, 0},
new float[]{0, 1, 0, 0, 0},
new float[]{0, 0, 1, 0, 0},
new float[]{0, 0, 0, 1, 0},
new float[]{-0.01f, -0.01f, -0.01f, 0, 0}
});
private void InitBufferAndGraphic()
{
mainBuffer = new Bitmap(panel1.Width, panel1.Height, PixelFormat.Format32bppArgb);
gMainBuffer = Graphics.FromImage(mainBuffer);
gMainBuffer.CompositingQuality = System.Drawing.Drawing2D.CompositingQuality.HighSpeed;
gMainBuffer.InterpolationMode = System.Drawing.Drawing2D.InterpolationMode.Low;
tempBuffer = new Bitmap(mainBuffer.Width, mainBuffer.Height);
gTempBuffer = Graphics.FromImage(tempBuffer);
imgAttribute = new ImageAttributes();
imgAttribute.SetColorMatrix(colormatrix, ColorMatrixFlag.Default, ColorAdjustType.Default);
gTempBuffer.CompositingQuality = System.Drawing.Drawing2D.CompositingQuality.HighSpeed;
gTempBuffer.InterpolationMode = System.Drawing.Drawing2D.InterpolationMode.NearestNeighbor;
}
gMainBuffer.DrawImage(tempBuffer, new Rectangle(-2, -1, mainBuffer.Width + 4,
mainBuffer.Height + 3), 0, 0, tempBuffer.Width, tempBuffer.Height, GraphicsUnit.Pixel, imgAttribute);
Limitations
The first limitation always is the performance. I did test this on the following machines, and the results are like this:
- Core 2 duo P8400, vga onboard: delay 20ms <-> 50 fps
- Laptop core 2 T6400, vga onboard: 60ms <-> 2x fps => big hurt
If I tried to maximize the application windows, the performance hit even more bad! Even on i5 2500K OC 4.2Ghz, using GTX 970.
Final Words
I need this project to be re-written in 3D mode (Managed DirectX/OpenGL) to get grid of performance problem. Anyone who is interested in this article, please help using the comments section below.
History
- 0.2: Add setting screen
- 0.1: Demo with effects from builtin GDI
