Introduction
This is a short tip about how you can display a bar chart using a simple select command in Oracle.
Background
It is said that a picture is worth a thousand words. Charts help you to visualize data quickly and are a compact way to present information. Also charts are more appealing to the mind than figures.
Using the code
We shall be using the LPAD function of Oracle to produce our chart. The LPAD function has the following syntax:
LPAD(string,pad_length,[pad_string])
The parameters of LPAD function are as follows:
- string: Represents the string to be padded
- pad_length: Specifies the length after padding.
- pad_string: It is an optional string which is used to fill the left side of the string. If omitted, LPAD fills the left side with spaces.
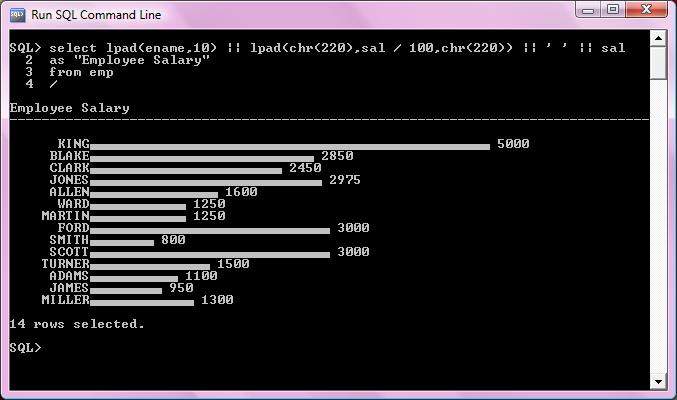
The following statement can be used to produce the chart.
select lpad(ename,10) || lpad(chr(220),sal / 100,chr(220)) || ' ' || sal
as "Employee Salary"
from emp
/
In the above statement, I am displaying the salary of employees from the sample table "emp". I am using the character 220 (chr(220)), to display the bars. The salary is scaled down to printable range by dividing it by 100.
Following is the output of the above select statement.

Points of Interest
You can experiment the select command with different characters to create charts with different patterns.
