Introduction
Anyone who has done some work with JavaScript knows it can be very frustrating. Often you have to use: Alert("I am here"); type of code to debug it. Visual Studio and IE (Internet Explorer) have the ability to debug JavaScript code, including setting break points in your JavaScript.
Background
When I started working in .NET, I was a VB.NET Windows programmer. When I started to use ASP.NET, the need to use JavaScript started to come up. It was easy for me to make mistakes in my JavaScript since it is a C based language, so there was a real need to have the ability to debug my JavaScript code. I don't think I would have ever ventured into the JavaScript world without being able to debug it in Visual Studio.
Setup
In IE you have to enable script debugging. Go to Tools, then Internet Options. Click on the Advanced Tab. Un-check disable script debugging (Internet Explorer). It is checked by default.

NOTE: you will find with script debugging enabled that many Internet sites have lots of JavaScript problems. So I would suggest only turning this on when you want to debug your JavaScript otherwise you will be bothered by IE asking you if you want to debug other peoples bad JavaScript.
Once you have this set, a new option is available in your View menu. If you click on View there is now a script debugger option. If you are using IE 7 you will need to click on Tools, then Menu bar to see the View menu item.

So at this point in Visual Studio, if you set your web project / web site to debug mode and run it, you can debug your JavaScript.
Under View/Script Debugger there are two options. The first is Open.

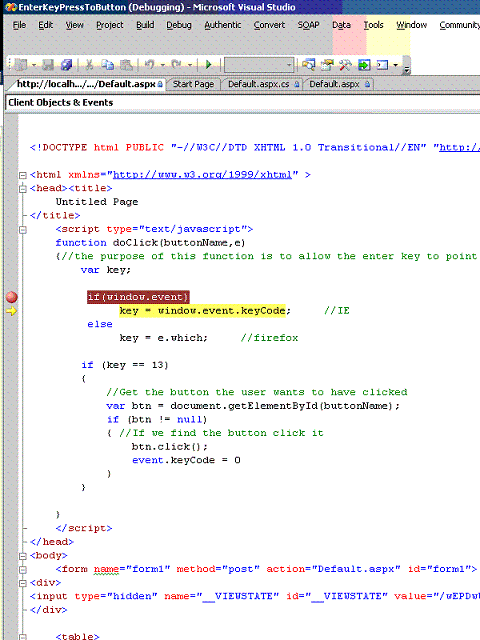
This will open the HTML/JavaScript in Visual Studio and allow you to set break points in your JavaScript.

The other option is Break at next statement which does just what it says. When the next JavaScript gets run, you will go into Visual Studio and it will break on the first JavaScript line.

Once you are in the Visual Studio debugger, you can use all of the normal tools you have to investigate variables etc. to help with the debugging of the JavaScript code.

Conclusion
I have found that being able to debug my JavaScript has really helped me to find all the small problems and bugs that are so easy to create when writing JavaScript code.
I hope this article helps you in your JavaScript debugging.
