Introduction
WinDbg is quite a powerful debugger, and it’s really easy to use it. It provides you with both UI and command prompt interfaces. The installation package is light, and it can be quickly installed on a target machine.
I noticed that for first timers, it is confusing to use WinDbg. One needs to point to the right location of the source files, the PDB file, and the executable before he/she can debug using WinDbg. It’s not very intuitive for a newbie with little debugging experience outside of Visual Studio. In this short demo, I would like in pictures, pedantically show a step by step of how to set WinDbg up for your debugging purposes.
Installation
First, one needs to install the debugging tools MSI package. The latest MSI package for this could be taken from the Microsoft site.
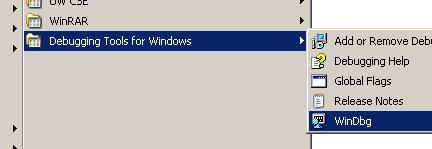
There are several MSI packages one could download and install, choose the 32-bit or 64-bit version and download the latest release. After the installation is complete, you can invoke WinDbg from your Start menu:

Sample program
Now, let’s create a small C++ program to calculate the GCC – the greatest common divisor.
File main.cpp:
#include <stdio.h>
#include <stdlib.h>
int calculateGCD(int a, int b);
void printHelp();
int main( int argc, const char* argv[] )
{
int numA, numB, gcd;
if (argc != 3)
{
printHelp();
return -1;
}
numA = atoi( argv[1] );
numB = atoi( argv[2] );
if(numA == 0 || numB == 0)
{
printf("Wrong input format, see help");
printHelp();
return -1;
}
if (numA < numB)
{
numA = numA ^ numB;
numB = numA ^ numB;
numA = numA ^ numB;
}
gcd = calculateGCD(numA, numB);
printf("Common divisor is: %d", gcd);
return 0;
}
int calculateGCD(int biggerNum, int smallerNum)
{
int remainder = biggerNum % smallerNum;
if (remainder == 0)
return smallerNum;
return calculateGCD(smallerNum, remainder);
}
void printHelp()
{
printf("This tool calculates a common greatest divisor");
printf("Usage: comdiv integerNumberA integerNumberB");
}
Now, compile and build it in debug mode so you can get the comdiv.exe and comdiv.pdb files. Let's put these files and the source file main.cpp into a dedicated folder like C:\windbgtest.

WinDbg
Now, let's start WinDbg from the Start menu.

Now, in order to start debugging, we need to point WinDbg to the symbol file comdiv.pdb, the source file main.cpp, and the executable comdiv.exe.
Go to File->Symbol File Path, and specify C:\windbgtest in the dialog.

Do the same for File->Source File Path, and File->Image File Path.
Now, go to File->Open Executable, and specify the comdiv.exe file in the dialog.

Also specify the arguments as in the picture. This will make comdiv.exe to find the GCC of 18 and 24. Once you hit the Open button, press No for the popped up dialog, suggesting to save the information for the workspace (it doesn’t really matter).
At this stage, you will see that WinDbg has created the comdiv.exe process:

Now, WinDbg has just created the process to run comdiv.exe, but it has not yet run it. So, at this point, it’s your chance to put some breakpoints.
Let’s open the source file main.cpp in WinDbg and put breakpoints there. Go to File->Open Source File, and specify C:\windbgtest\main.cpp there.

Once you push Open, you will see your source code:

Now, put the cursor on line 11 (“if (argc != 3)”) and press F9 (or click the “hand” icon in the Toolbar).
You might get this dialog popped up:

If you get this dialog, just press Yes, and you will have your breakpoint set up:

Now, the red line means that your breakpoint is set up and ready to be hit.
Press F5 to run the program, and it will break on your breakpoint line (you will see that the red line becomes pink):

Now, you can step through your source code using either the Toolbar or the standard F* keys: F10 – step over, F11 or F8 – step into, etc.
There are numerous standard debug commands available in the View and Debug menus, just explore and try them all.
You can also navigate your mouse over the local variables and see their values (like in the picture below; you can also see the current execution point, it's highlighted blue):

Now, you are all set to go!
