Introduction
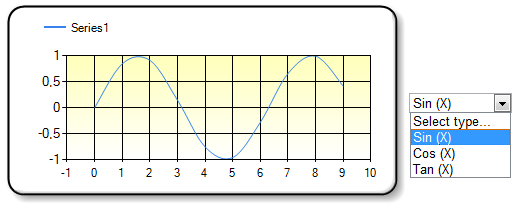
This article shows a way to improve ASP.NET charting control capabilities with jQuery. The chart control provided by Microsoft with .NET Framework 3.5 SP1 is a very useful server control with a lot of features. In a real situation, you can have the need to use it client-side, without taking advantage of the ASP.NET server control model. In the example below, I will show a chart that changes based on the selected value in a dropdrown list.
Background
For those who have never heard about it, jQuery is an extremely lightweight and powerful JavaScript library that provides cross-browser compatibility. jQuery popularity among Web developers is growing, to the point that even Microsoft has decided to include it in the ASP.NET MVC framework. On September 2008, Microsoft released the ASP.NET Chart control, a server control to help create graphs of strong visual impact, easy to use, and highly configurable. Here are the prerequisites for using the ASP.NET charting control:
- .NET Framework 3.5 SP1
- Visual Studio 2008 (SP1 if possible)
- Microsoft Chart control
- Visual Studio 2008 Tools Support for the Chart control
In addition, you also need:
- the latest *.js file of the jQuery JavaScript library (1.3.2 at the time I'm writing)
- the jQuery-JSON plug-in available here
Using the Code
Here is the content of the WebSamples project:

- ChartImageDestructor.cs: contains the definition of
CacheItemRemovedCallback - RuntimeChart.cs: class that creates the chart object at runtime
- jquery-1.3.2.min.js: jQuery library script file minified
- jquery.json-1.3.min.js: the jQuery-JSON plug-in script file minified
- Default.aspx: test page
- SampleWebService.asmx: a Web Service that exposes methods called by the client
After decompressing the .zip file, you can create an application under IIS or use the Visual Studio Developer Server. You also must ensure that the TempChartImage folder has the right privileges.
Part 1: Server-Side
First, I create a Web Service in the web application called SampleWebService.asmx. This provides a Web Method DrawChart to render the chart server-side and returns the chart image filename.
[WebMethod]
public String DrawChart(Int32 iType){
RuntimeChart runChart = new RuntimeChart();
Chart m_chart = runChart.makeChart(iType);
String tempFileName = String.Format("TempChartImage/Chart_{0}.png",
System.Guid.NewGuid().ToString());
tempFileName = Context.Server.MapPath(tempFileName);
m_chart.SaveImage(tempFileName);
String strImageSrc = @"TempChartImage/" +
Path.GetFileName(tempFileName);
ChartImageDestructor cid = new ChartImageDestructor(tempFileName);
CacheItemRemovedCallback onRemove =
new CacheItemRemovedCallback(cid.RemovedCallback);
HttpContext.Current.Cache.Add(tempFileName, cid, null,
DateTime.Now.AddMinutes(10),
System.Web.Caching.Cache.NoSlidingExpiration,
System.Web.Caching.CacheItemPriority.NotRemovable,
onRemove);
return strImageSrc;
}
The char image is rendered and saved in the server file system in the TempChartImage directory. The class ChartImageDestructor defines a CacheItemRemovedCallback that is responsible to delete the temp file after a certain elapsed period. The uniqueness of the filename is guaranteed by the function System.Guid.NewGuid() that instantiates a new Globally Unique Identifier.
Part 2: Client-Side
Now, let's take a look at the Default.aspx page. First, I include the script file for jQuery and the jQuery-JSON plug-in.
<script type="text/javascript" src="Script/jquery-1.3.2.min.js"></script>
<script type="text/javascript" src="Script/jquery.json-1.3.min.js"></script>
The HTML view contains an img tag and a select element with three options:
<div>
  <table>
     <tr>
        <td>
           <img id="ChartArea" />
        </td>
        <td>
           <select id="graphType">
              <option value="-1">Select type...</option>
              <option value="1">Sin (X)</option>
              <option value="2">Cos (X)</option>
              <option value="3">Tan (X)</option>
           </select>
        </td>
     </tr>
   </table>
 </div>
Finally, this is the script part with jQuery:
<script type="text/javascript">
var WebServiceURL = "/SampleWebService.asmx";
$(function() {
$("#graphType").change(function() {
getChartImage($("option:selected", this).attr("value"));
});
});
function getChartImage(type) {
if (type < 0)
return;
var dataPassed = new Object();
dataPassed.iType = type;
$.ajax({
type: "POST",
contentType: "application/json; charset=utf-8",
url: WebServiceURL + "/DrawChart",
data: $.toJSON(dataPassed),
success:
function(msg) {
var data = $.evalJSON(msg).d;
$("#ChartArea").attr("src", data);
},
error:
function(XMLHttpRequest, textStatus, errorThrown) {
alert(XMLHttpRequest.responseText);
}
});
}
</script>
Conclusion
This example has showed you what these two technologies are able to do using them together. Based on the actual trend in web development to execute a growing quantity of code client-side, it can be expected that situations like these will be more and more frequent. In this scenario, jQuery can give significant help to make client-side development faster and more comprehensible and functional.
History
