Table of Contents
In this article, we will look at how we can trace and debug information in WCF services. There are some ready made tracelisteners provided by WCF. The base of these ready made trace listeners is .NET trace listener. So we will first understand the basic concept of trace listener and then go through the ready made tracelisteners provided by WCF.
Now a days, I am distributing my 400 questions and answers ebook which covers major .NET related topics like WCF, WPF, WWF, Ajax, Core .NET, SQL Server, Architecture and a lot more. I am sure you will enjoy this ebook.
If you are new to WCF, I will recommend that you give one read to my WCF FAQs before reading this article. It will help you to understand WCF fundamentals so that you can understand this article much better.
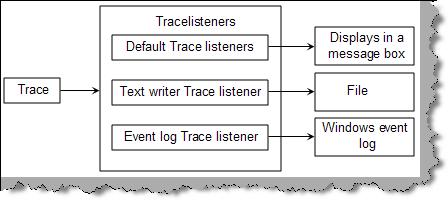
Tracelisteners are objects that get tracing information from the trace class and they output the data to some medium. For instance, you can see from the figure TraceListener how it listens to the trace object and outputs the same to UI, File or a Windows event log. There are three different types of tracelisteners, the first is the defaulttracelistener (this outputs the data to UI), the second is textwritertracelistener (this outputs to a file) and the final one is ‘Eventlogtracelistener’ which outputs the same to a Windows event log.

Figure: TraceListener
Below is a code snippet for textwritertracelistener and eventlogtracelistener. Using textwritertracelistener, we have forwarded the traces to ErrorLog.txt file and in the second snippet, we have used the Eventlogtracelistener to forward the traces to Windows event log.

Figure: Tracelistener in action
You can always use the core Tracelistener events provided by .NET, but WCF has readymade trace listeners for the core WCF objects.
| Assembly Name | Description |
System.ServiceModel | Logs the following:-
- Message process
- Reading of configuration information
- Transport-level action
- Security requests
|
System.ServiceModel.MessageLogging | Generates tracing information for every message that flows through the system. |
System.ServiceModel.IdentityModel | Generates trace data for authentication and authorization. |
System.ServiceModel.Activation | Emits information regarding activation of the service. |
System.Runtime.Serialization | Emits information when objects are serialized or deserialized. WCF always serializes and de-serializes information during request so it’s a good event to see the content of the request. |
System.IO.Log | Emits messages with respect to Common Log File System (CLFS). |
CardSpace | Emits trace messages related to any CardSpace identity processing that occurs within WCF context. |
We will enable tracing on System.ServiceModel tracing object. To enable tracing, we need to enable the system.diagnostics XML node in the web.config file of the WCF service. We need to also define the type of listeners for the System.ServiceModel listener object. So we add the listeners tag with the type as System.Diagnostics.XmlWriterTraceListener. We need to also define the file and path where the file is created. For the current scenario, we have defined the file as Traces.svclog and the folder as c:\ drive.
<system.diagnostics>
<sources>
<source name="System.ServiceModel"
switchValue="Information, ActivityTracing">
<listeners>
<add name="log"
type="System.Diagnostics.XmlWriterTraceListener"
initializeData="c:\Traces.svclog" />
</listeners>
</source>
</sources>
</system.diagnostics>
Now if you run the WCF service, you can see an XML file created as shown below:
#<E2ETraceEvent xmlns="http://schemas.microsoft.com/2004/06/E2ETraceEvent">
<System xmlns="http://schemas.microsoft.com/2004/06/windows/eventlog/system">
<EventID>0</EventID>
<Type>3</Type>
<SubType Name="Transfer">0</SubType>
<Level>255</Level>
<TimeCreated SystemTime="2009-04-30T03:21:09.5625000Z" />
<Source Name="System.ServiceModel" />
<Correlation ActivityID="{00000000-0000-0000-0000-000000000000}"
	RelatedActivityID="{d11829b7-d2db-46d5-a4ac-49a37a56376e}" />
<Execution ProcessName="WebDev.WebServer" ProcessID="2660" ThreadID="8" />
<Channel/>
<Computer>COMPAQ-JZP37MD0</Computer>
</System>
<ApplicationData></ApplicationData>
</E2ETraceEvent>
In the previous question, we have specified switch value as information. This value indicates what type and level of tracing information you want to record. Below is the list of the same.
| Trace Level | Description |
Off | Ignore all trace messages |
Critical | Log unexpected processing events or unhandled exceptions have occurred. The application will terminate immediately or shortly. |
Error | An unexpected processing event or exception has occurred. The application is still capable of continuing its processing. |
Warning | Indicates there is a possible problem but the application will continue running. |
Information | Application is running smoothly only that informative message is recorded. In this case, messages are just milestones. |
Verbose | Very similar to information but provides more details as compared. |
ActivityTracing | In this case, messages are related to communication between components and the activities. |
All | In this case, all messages are captured. |
Trace level value is specified in source tag in switch value. For instance the below web.config snippet indicates the trace type as Information.
<system.diagnostics>
<sources>
<source name="System.ServiceModel"
switchValue="Information, ActivityTracing">
............
............
............
............
You can log WCF messages at two levels, one is service level and the other is transport level. Service level: In this, the messages are logged as they enter the user code or leave the user code.
Transport level: In this, the messages are logged as they are ready to be encoded / decoded. All transport level, infrastructure messages and also reliable messaging is logged. You specify the message levels in the diagnostics node as shown in the below code snippet.
<system.serviceModel>
<diagnostics>
<messageLogging
logEntireMessage="true"
logMalformedMessages="false"
logMessagesAtServiceLevel="false"
logMessagesAtTransportLevel="true"
maxMessagesToLog="3000"
maxSizeOfMessageToLog="10000"/>
</diagnostics>
</system.serviceModel>
Messagelogging also has other attributes. Below is the short description about the same.
| Attribute | Description |
logEntireMessage | Should the entire message be logged on only the header. |
logMalformedMessages | Should malformed messages be logged. |
logMessagesAtServiceLevel | Should service-level messages be logged. |
logMessagesAtTransportLevel | Should transport level messages be logged. |
maxMessageToLog | Number indicating how many messages should be logged. |
maxSizeOfMessageToLog | The default value is 256Kb. Max size of the message log. |
History
- 30th April, 2009: Initial post
